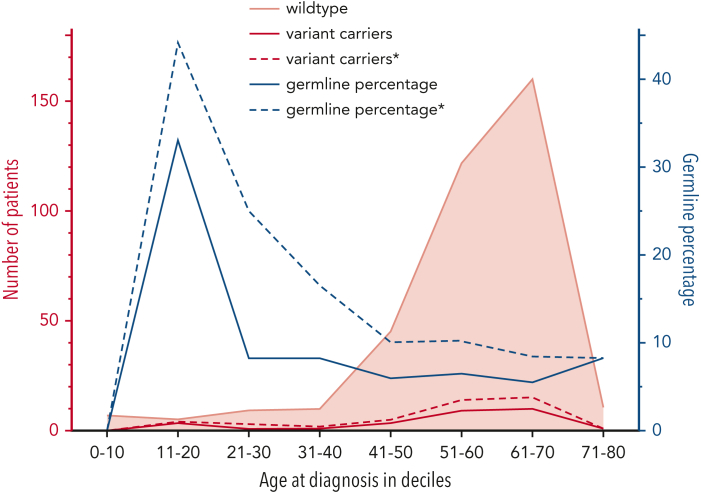
Figure 3.
Age distribution of pathogenicknownand presumed germ line variants in patients with MDS. The number of patients with MDS (left y-axis, red) with a confirmed germ line variant (red, solid line), a presumed germ line variant (red, dashed line), or wild-type (ie, without a germ line variant; peach, solid line with shading) is plotted per age decile (x-axis). The percentage (right y-axis, blue) of confirmed germ line variants (blue, solid line) and presumed germ line variants∗ (blue, dashed line) is plotted per age decile. ∗Presumed germ line variants based on a multiple-criteria decision analysis.

