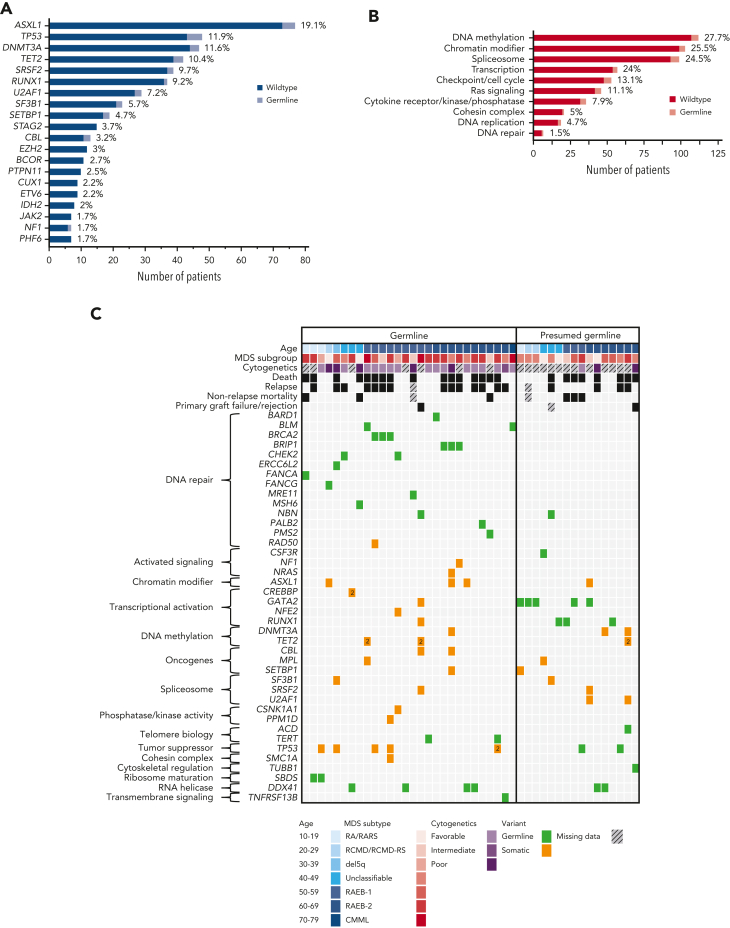
Figure 5.
Spectrum and distribution of germ line variants, co-occurring somatic variants, and clinical data. (A) Bar chart displaying the top 20 most commonly affected genes for somatic variants (dark blue, wild-type; light blue, confirmed or presumed germ line variant). Percentages are given at the end of each bar. (B) Bar chart showing the top 10 most commonly affected gene groups (by broad gene ontology and biological pathways) (dark red, wild-type; light red, confirmed or presumed germ line variant). Percentages are given at the end of each bar. (C) Mutational grid with all 28 patients with MDS with confirmed germ line P/LP variants (left) and the 16 patients with MDS with presumed germ line variants (right). Patients are grouped by age at diagnosis in both panels. (Top) Clinical data such as age, MDS subtype, cytogenetic analysis, and outcome parameters, including death, relapse and nonrelapse mortality, and primary graft failure/rejection as well as co-occurring somatic variants (grouped by broad gene ontology and biological pathways) are included. (Bottom) The legend indicates the colors used for age deciles, MDS subgroups, cytogenetic analysis, variant status, and missing data. CMML, chronic myelomonocytic leukemia; MDS, myelodysplastic syndrome; RA, refractory anemia; RAEB, refractory anemia with excess blasts; RARS, refractory anemia with ring sideroblasts; RCMD, refractory cytopenia with multilineage dysplasia; RCMD-RS, refractory cytopenia with multilineage dysplasia and ring sideroblasts.

