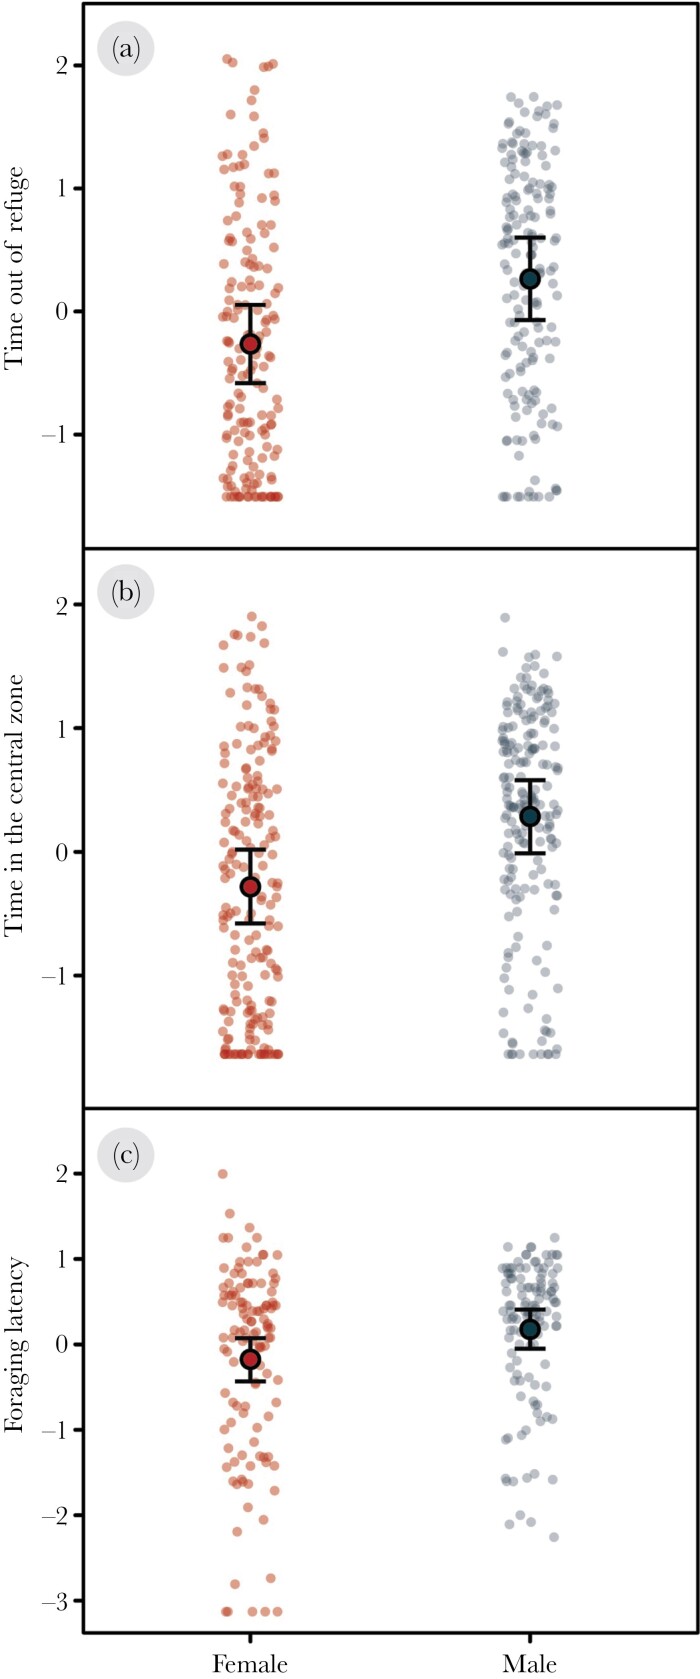
Figure 2.
Sex differences in risk-taking behavior. Plots represent conditional effects (± 95% CrI) extracted from the Bayesian, hierarchical linear mixed-effects models for (a) time out of the refuge, (b) time in the central zone, and (c) foraging latency. Estimates are shown for both females (red) and males (blue). Red and blue semi-transparent points represent individual data points for females and males, respectively. Foraging latency scores were inverted so that higher scores represent bolder individuals that were quicker to feed. Behavioral scores are presented in standardized units.

