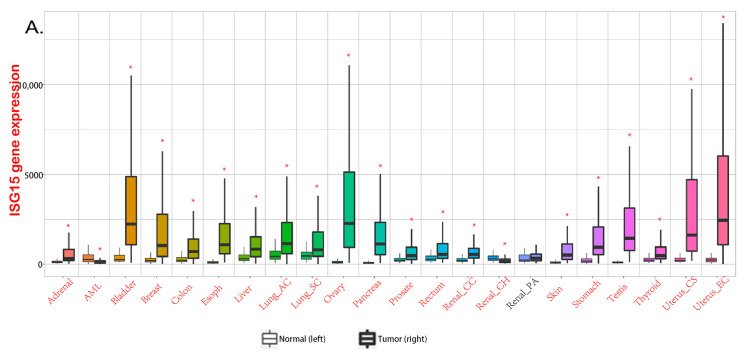
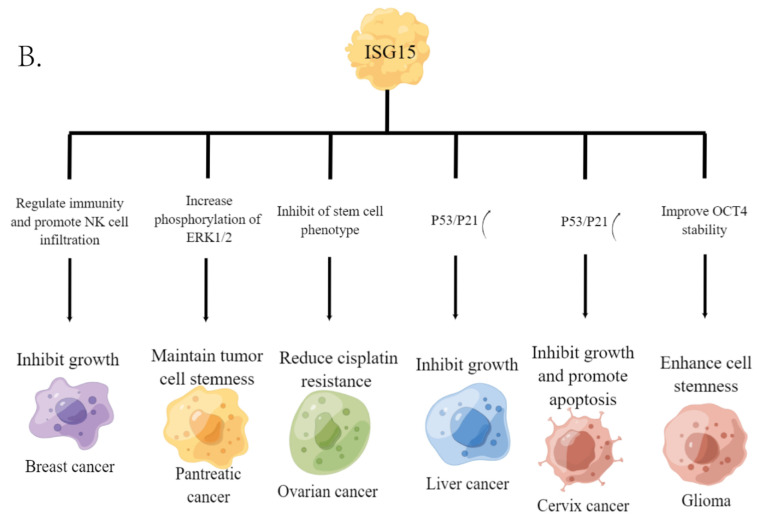
Figure 2.
ISG15 in various cancers. (A) expression levels of ISG15 in different cancers. Data from TNMplot, significant differences by Mann-Whitney U test are marked with red [32]. * p < 0.05 vs. normal group. (B) the functional roles of free ISG15 in various cancers.


