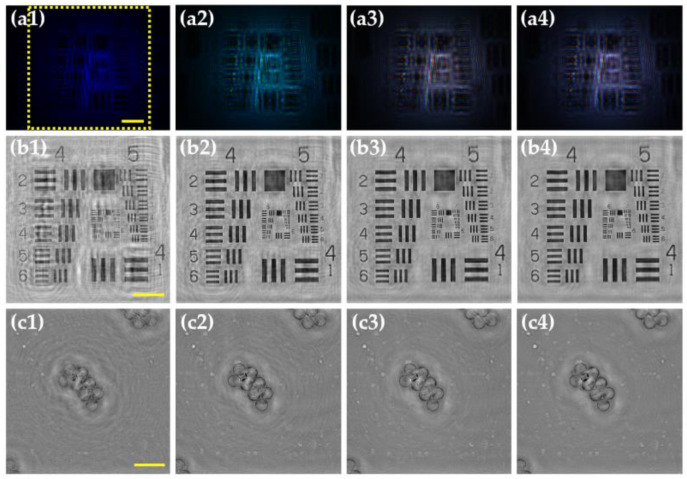
Figure 5.
MISHELF microscopy implemented using different illumination/detection channels [49]. Rows (a,b): color holograms and amplitude reconstructions involving an USAF test target, respectively; row (c): phase images involving several 90 μm microspheres. (a1–c1): conventional LHM (V illumination); (a2–c2), (a3–c3) and (a4–c4): MISHELF microscopy implemented with two (V-G), three (V-G-R) and four (V-B-G-R) illumination wavelengths, respectively. Yellow scale bars in column (1) represent 100 μm.

