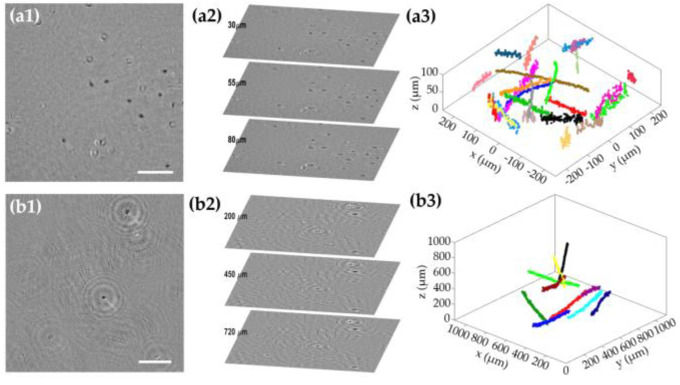
Figure 7.
Sperm motility analysis performed with MISHELF microscopy involving different types of sperm cells. Rows (a,b) human and starry skate fish spermatozoa, respectively. (a1,b1) reconstructed amplitude images in a sample plane; (a2,b2) perspective views of three different planes showing sperm cells in focus; (a3,b3) 3D trajectories of some spermatozoa. Scale bars in (a1,b1) represent 100 and 200 μm, respectively.

