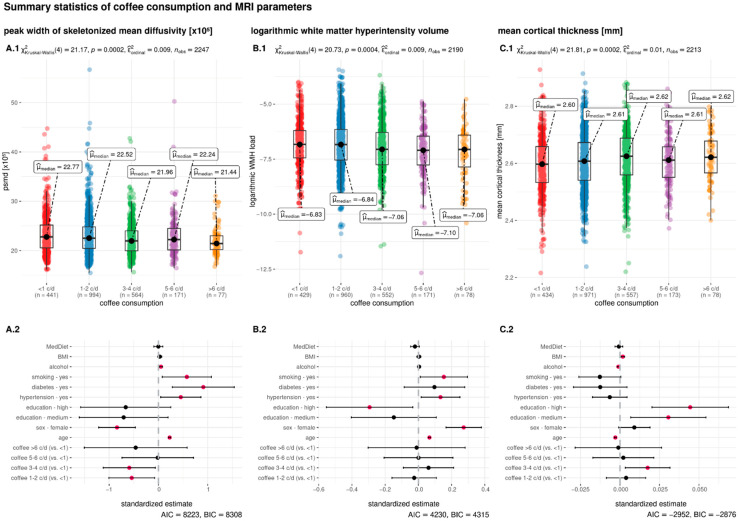
Figure 1.
Summary statistics of the association between coffee consumption and the MRI parameters. Daily coffee consumption is indicated in cups per day (c/d) and categorized in five groups (<1 c/d, 1–2 c/d, 3–4 c/d, 5–6 c/d, >6 c/d). The upper row shows boxplots with the groups of coffee consumption on the x-axis and peak width of skeletonized mean diffusivity (PSMD, (A.1)) logarithmic white matter hyperintensity load (log WMH load, (B.1)) and mean cortical thickness (C.1) on the y-axis. The inferential test results above the boxplots indicate the output from the non-parametric Kruskal–Wallis test. The bottom row shows the results of the linear regression models where the dependent variable is either PSMD (A.2), log WMH load (B.2), or mean cortical thickness (C.2). Independent variables are the same in all regressions and presented on the y-axis. The standardized estimates are presented on the x-axis. Pink dots indicate a significant association and black dots a non-significant association of the independent variable. Abbreviations: AIC = Akaike information criterion; BIC = Bayesian information criterion; c/d = cups per day; MedDiet = adherence to the Mediterranean diet; mm = millimeter; nobs = number of observations; p = p-Value; μmedian = median; χ2 = chi-square from the Kruskal–Wallis test.

