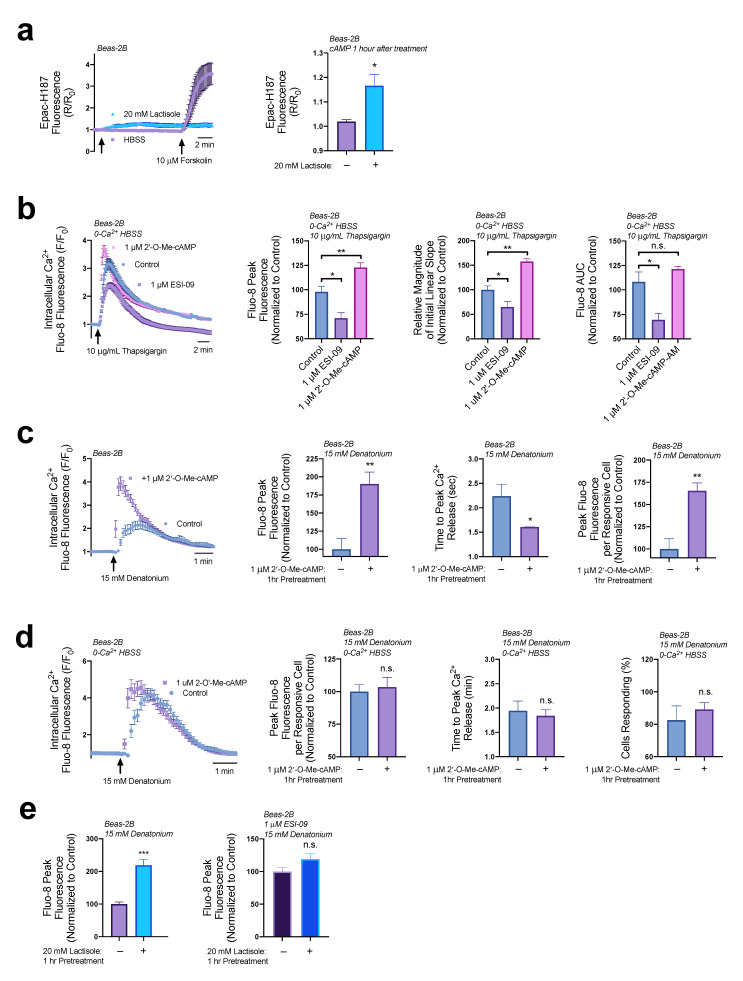
Figure 4.
EPAC regulates ER Ca2+ content and efflux. (a) The 20 mM lactisole treatment caused a sustained increase in cAMP as detected by Epac-S-H74 biosensor. (b) EPAC agonist 2′-O-Me-cAMP (1 µM, 1 h pretreatment) increased peak ER Ca2+ release by 25%, increased the magnitude of the initial linear slope by 50% but had no effect on total ER Ca2+ content while antagonist ESI-09 (1 µM, 1 h pretreatment) decreased peak ER Ca2+ release by 25%, decreased the magnitude of initial linear slope by 35%, and reduced total ER Ca2+ content by 30%. (c) EPAC agonist 2′-O-Me-cAMP (1 µM, 1 h pretreatment) increased denatonium-induced Ca2+ elevations by 1.8-fold, reduced the time it took to reach maximal Ca2+ elevations by 30 s, and increased the Ca2+ released per cell by 67%. In a similar experiment as (d) Beas-2Bs preincubated with 2′-O-Me-cAMP (1 µM, 1 h) were stimulated with 15 mM denatonium in 0-Ca2+ HBSS, revealing no significant changes in peak Ca2+ elevations per cell or time to peak Ca2+ elevation. (e) The 20 mM lactisole (1 h pretreatment) increases denatonium-induced Ca2+ release by ~200% but is blocked by EPAC inhibitor ESI-09 (1 µM for 1 h pretreatment). Traces are representative of ≥3 experiments. Bar graphs containing 2 comparisons were analyzed via t-test; bar graphs containing >2 comparisons were analyzed via ANOVA using Dunnett’s post-test for multiple comparisons * p < 0.05, ** p < 0.01, *** p < 0.001, “n.s.” represents no significance.

