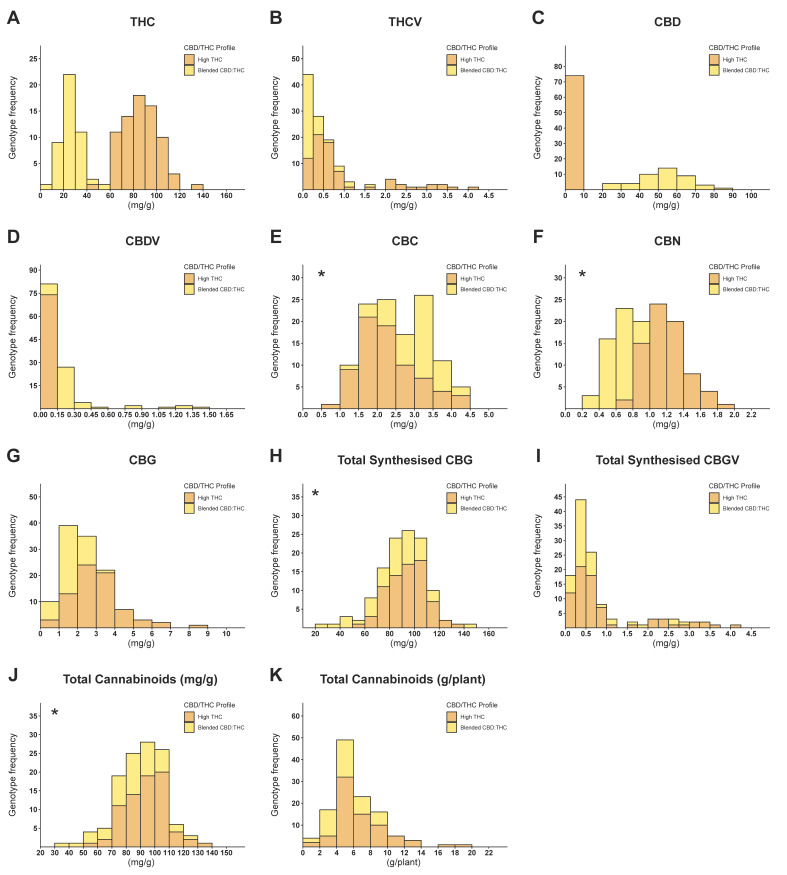
Figure 1.
Frequency distribution of 119 cannabis genotypes across 11 cannabinoid parameters. Orange segments represent high-THC genotypes, and yellow segments represent blended THC:CBD genotypes. Charts marked with an asterisk on the top left corner are normally distributed. (A) Δ9-tetrahydrocannabinol (THC) content (mg/g), (B) Δ9-tetrahydrocannabivarin (THCV) content (mg/g), (C) cannabidiol (CBD) content (mg/g), (D) cannabidivarin (CBDV) content (mg/g), (E) cannabichromene (CBC) content (mg/g), (F) cannabinol (CBN) content (mg/g), (G) cannabigerol (CBG) content (mg/g), (H) total synthesised CBG (mg/g), (I) total synthesised CBGV (mg/g), (J) total cannabinoid concentration (mg/g), (K) total cannabinoid per plant (g/plant).

