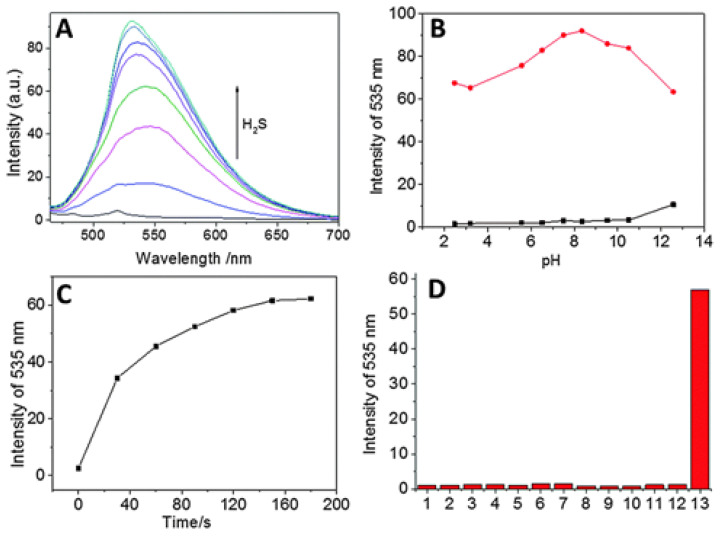
Figure 7.
(A) Fluorescence spectra of probe 13 treated with Na2S (0–100 μM); (B) fluorescence intensity of probe 13 in the absence (black) and presence (red) of Na2S, and at varying pH; (C) time course of fluorescence intensity of probe 13 in the presence of Na2S; (D) fluorescence intensities of probe 13 treated with various relevant analytes (1) probe only; (2) F−; (3) GSH; (4) H2O2; (5) Hcy; (6) I−; (7) Cys; (8) NO2−; (9) S2O32−; (10) SO32−; (11) HSO32−; (12) NO3−; (13) Na2S, in PBS buffer (pH 7.4, containing 50% DMF as a cosolvent). Reprinted with permission from Ref. [64]. Copyright ©2016 Royal Society of Chemistry.

