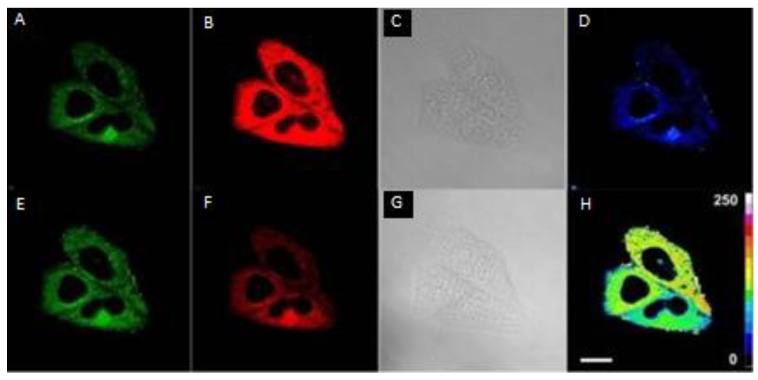
Figure 17.
Confocal fluorescent microscopic images of probe 26 stained HepG-2 cells in the absence (A–D) and presence (E–H) of NaHS; (A,E) green channel; (B,F) red channel; (C,G) bright-field images; (D,H) pseudo-color ratio images obtained from green channel and red channel. Reprinted with permission from Ref. [69]. Copyright ©2020 Royal Society of Chemistry.

