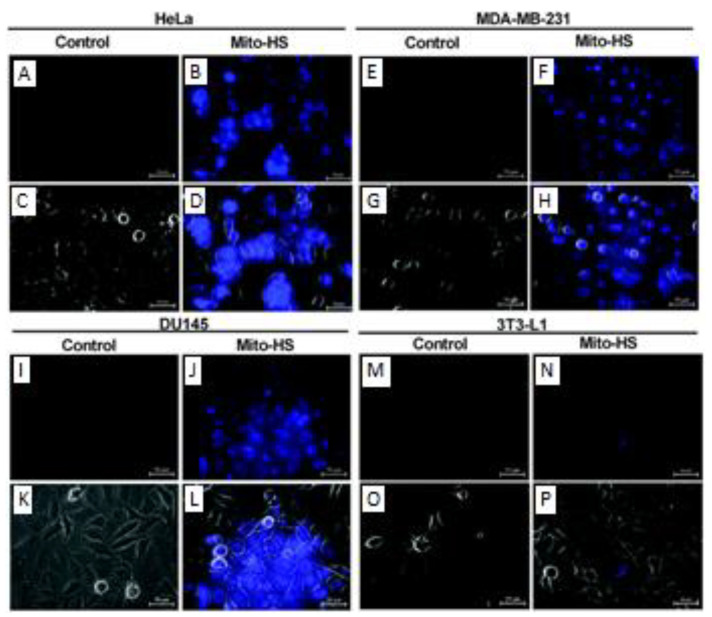
Figure 27.
Fluorescence microscopy images of untreated HeLa (A), MDA-MB-231 (E), DU145 (I), and 3T3-L1 (M) cells and (B,F,J,N) the same cells, respectively, treated with probe 43 (5 μM). (C,D,G,H) and (K,L,O,P) are overlays of DIC bright-field images with the corresponding fluorescence images. Reprinted with permission from Ref. [76]. Copyright ©2017 Royal Society of Chemistry.

