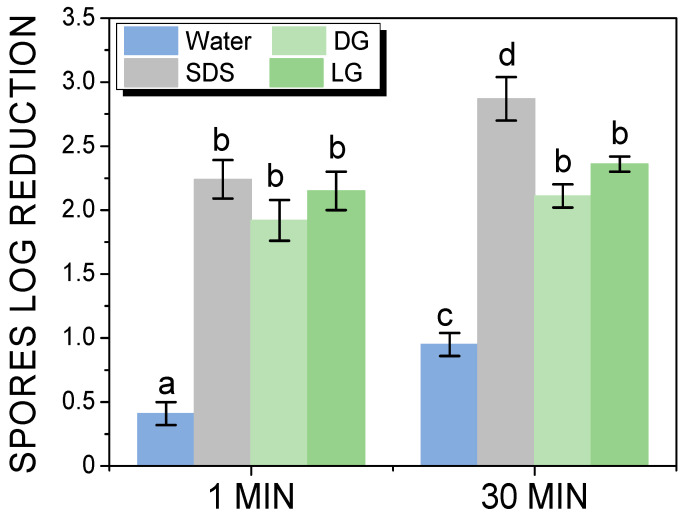
Figure 2.
Spores log reduction on the plate in dynamic condition during foam flow cleaning after 1 and 30 min of foam flow as a function of the surfactant in comparison to water. The small letters a–d indicate groups of statistical differences according to Tukey’s test (p < 0.05) between the water and the surfactants for 1 min of foam flow cleaning and for 30 min of foam flow cleaning.

