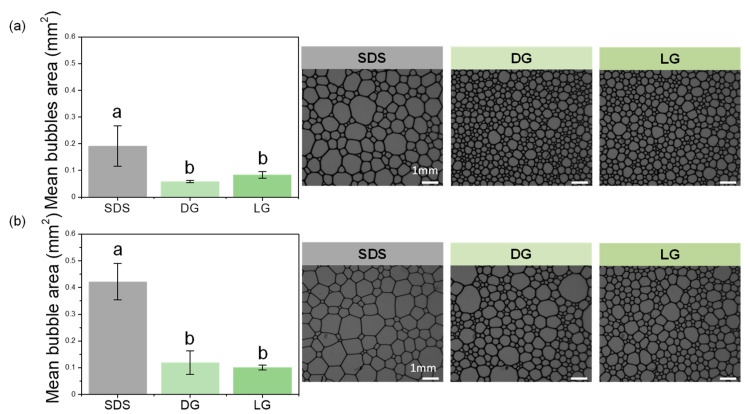
Figure 5.
Mean bubbles area of the foams produced with SDS, DG, and LG with the corresponding microscopic pictures: (a) before the foam passed through the duct containing the plate contaminated with spores and (b) after the foam passed through the duct. The scale bar represents 1 mm for all the foam pictures. The small letters a–b indicate groups of statistical differences according to Tukey’s test (p < 0.05).

