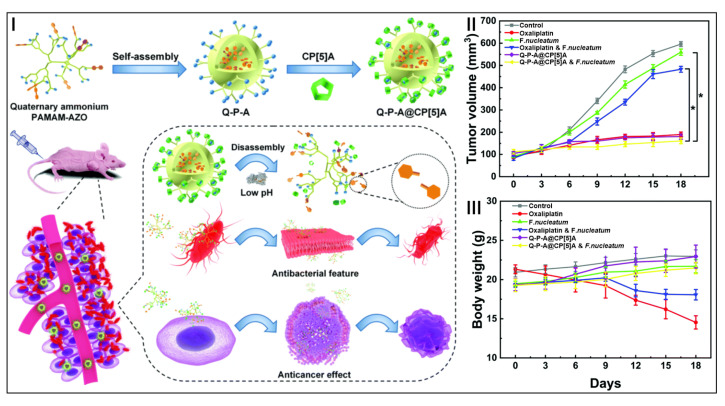
Figure 5.
Schematic illustration of Q-P–A@CP[5]A in antibacterial and antitumor therapies (I). Tumor growth inhibition curves of HT29 tumor-bearing nude mice after various formulations (* p < 0.05) (II). Body weights of HT29 tumor-bearing nude mice after various formulations (III). (reproduced with permission of Royal Society of Chemistry from ref. [136]).

