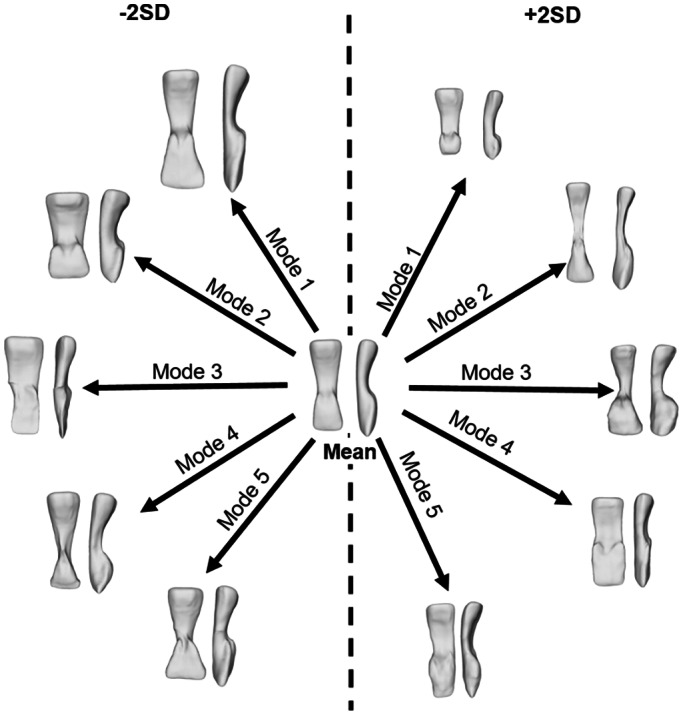
FIGURE 5.

Visual summary of the shape variation described by each of the modes of the oropharynx model (anterior view [left model] and lateral view [right model]) for all participants (n = 48). Each mode is shown at the limits of minus 2 standard deviations (−2SD) from the mean shape and plus 2 standard deviations (+2SD). Mode 1 described variance in isometric size including elongation; mode 2 width and depth; mode 3 retroglossal antero‐posterior dimension; mode 4 lateral dimensions at the retropalatal and retroglossal junction and mode 5 the lateral dimension at the inferior retroglossal region
