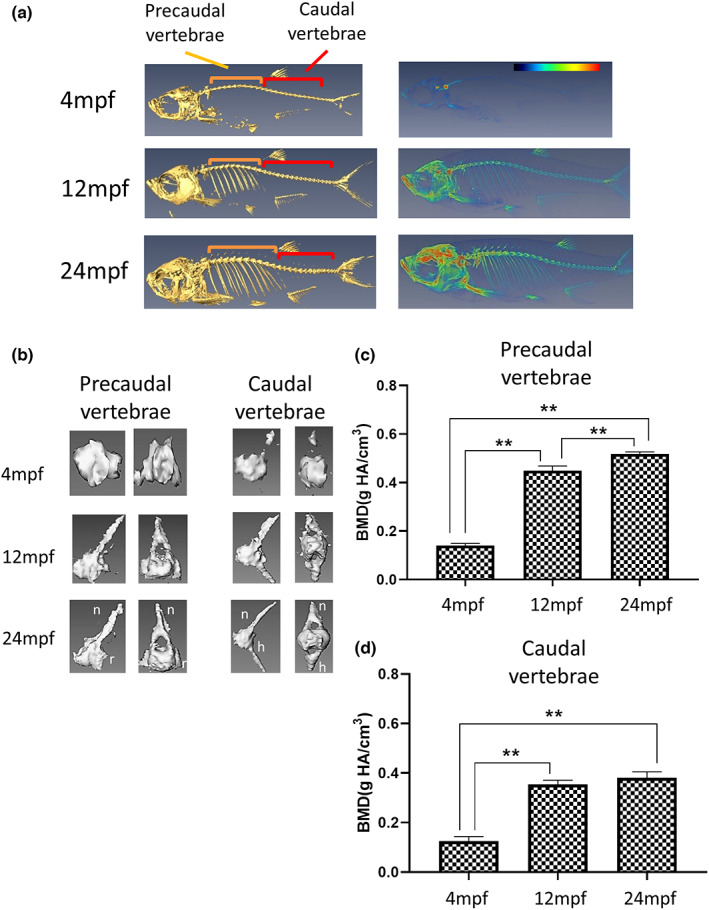
FIGURE 1.

Micro‐CT images and vertebral BMD of zebrafish at different ages. (a) Left panels show the full scan of the whole fish at the median plane. The orange regions mark the precaudal vertebrae, while the red indicate the caudal vertebrae. Right panels represent the converted heatmap of the micro‐CT data. Red indicates the higher value of BMD, while blue refers to the low value of BMD. (b) Micro‐CT image of the individual vertebra, both the median and the transverse plane. The left panel shows the precaudal vertebrae, with the neural arches (n) and ribs (r) labelled. The right panel displays the caudal vertebrae, featured with the haemal spines (h). (c) Quantified BMD value of precaudal vertebrae. (d) Quantified BMD value of caudal vertebrae. The vertebrae BMD increased from 4 mpf fish to 12 mpf and slightly increased or maintained in 24 mpf fish (n = 5). Statistically significant differences with p‐value <0.01 were evaluated by the Mann–Whitney U test and are annotated with**.
