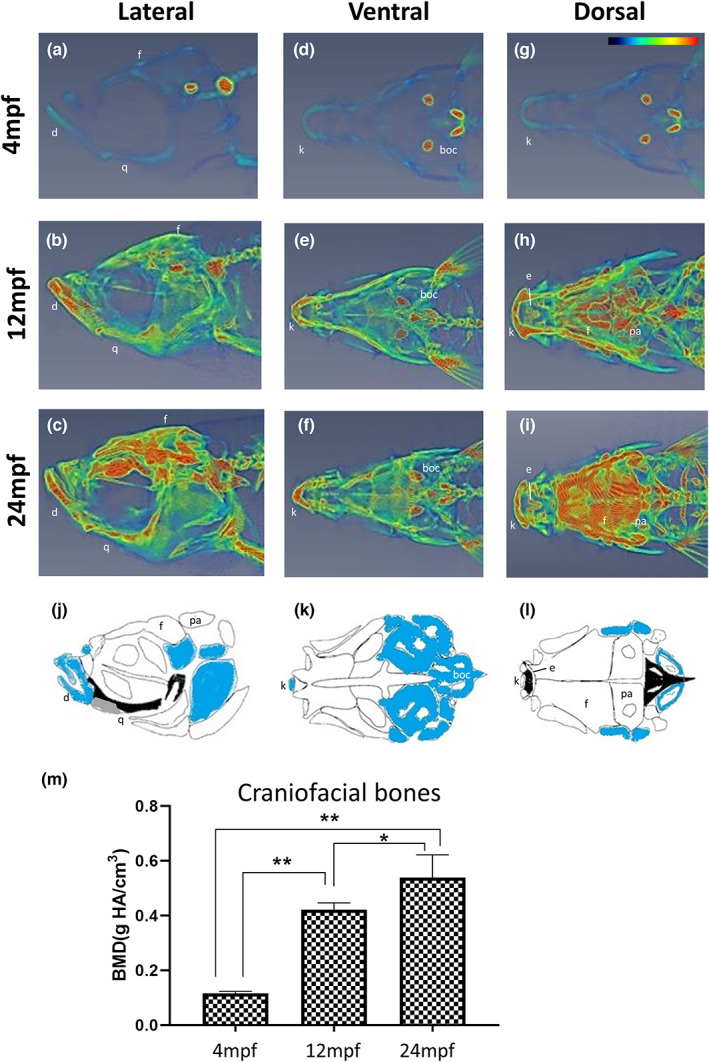
FIGURE 2.

Micro‐CT images and craniofacial BMD of zebrafish head at different ages. Data represent the converted heatmap of the micro‐CT data focused on the zebrafish head in (a–c) lateral view, median plane; (d–f) ventral view, frontal plane; (g–i) dorsal view, frontal plane. Red indicates the higher value of BMD, while blue refers to the low value of BMD. (j–l) diagrams indicating the bone types in the zebrafish head: Acellular compact bones (white), cellular compact bones (blue), spongy bone (grey) and tubular bones (black) corresponding to the CT data. It should be noted that the base of the neurocranium was shown without the pharyngeal skeleton. Drawings were modified from (Kague et al., 2012). (m) Quantified BMD values of zebrafish skull. The craniofacial BMD increased from young fish to 12 mpf and slightly increased in the 24 mpf fish (n = 5). Statistically significant differences with p‐value <0.05 and 0.01 were evaluated by the Mann–Whitney U test and annotated with * and ** respectively. boc, basioccipital; d, dentary; e, ethmoid; f, frontal; k, kinethmoid; pa, parietal; q, quadrate.
