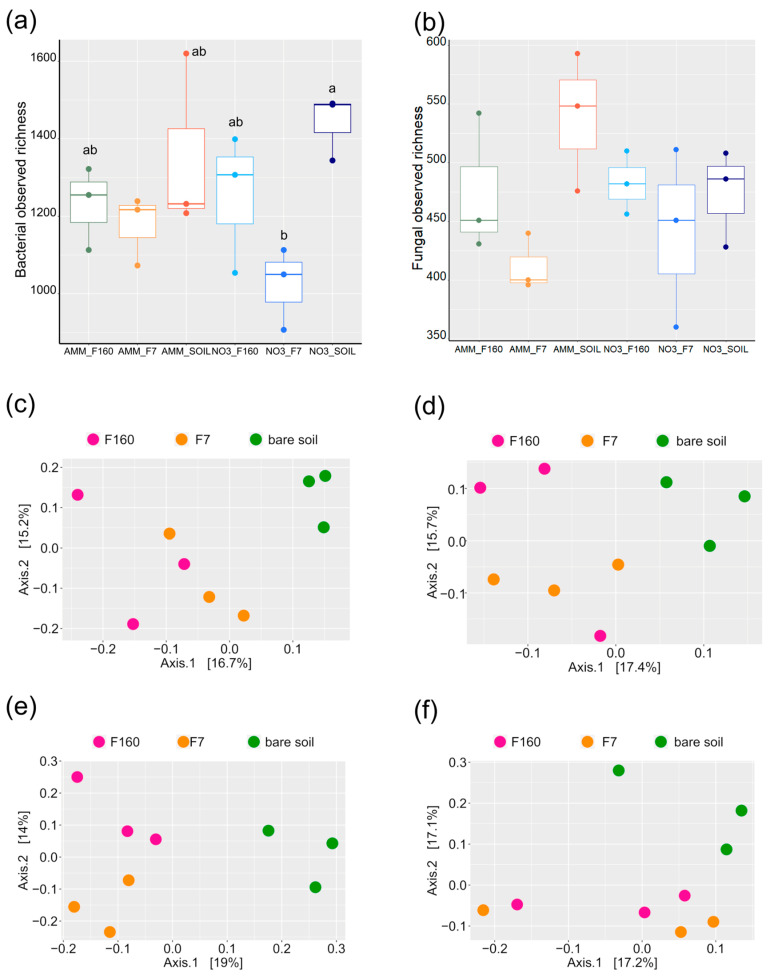
Figure 4.
Box plots of the observed richness of (a) bacterial and (b) fungal community in the experimental treatments studied. The experimental treatments included fertilization with ammonium (AMM) or nitrate (NO3) and addition of genotype F160 or F7 or no plant (SOIL), resulting in the abbreviations used (AMM_F160; AMM_F7; AMM_SOIL; NO3_F160; NO3_F7; NO3_SOIL). Principal coordinates analysis of the bacterial (c) and fungal (d) communities in the ammonium treatment of genotype F160 or F7 or no plant (SOIL). Principal coordinates analysis of the bacterial (e) and fungal (f) communities in the nitrate treatment of genotype F160 or F7 or no plant (SOIL). In the boxplots, different letters indicate significant differences based on Tukey’s HSD test, p < 0.05.

