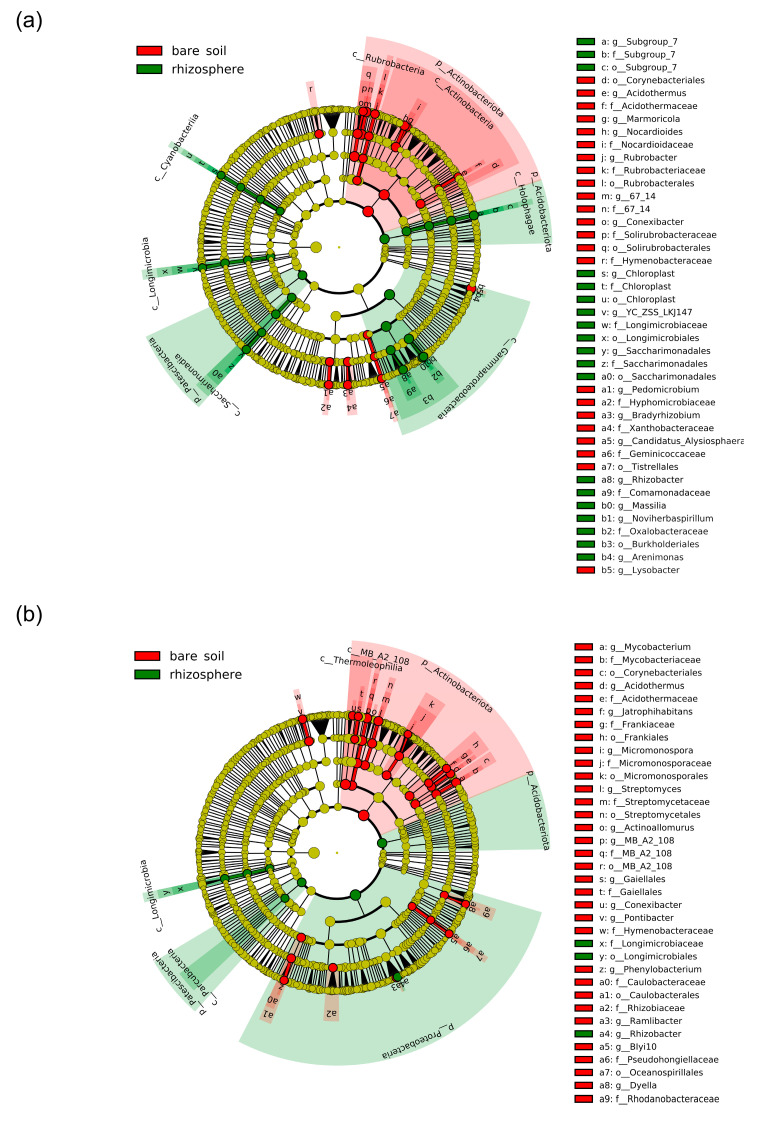
Figure 5.
Cladogram illustrating the taxonomic groups explaining the most variation among the bacterial taxa between the bare soil and the rhizosphere samples detected in the (a) ammonium and (b) nitrate treatments. Each ring represents a taxonomic level, with phylum (p_), class (c_), order (o_), family (f_), and genus (g_) emanating from the center to the periphery. Each circle is a taxonomic unit found in the dataset, with circles or nodes shown in colors (other than yellow) indicating where a taxon was significantly more abundant.

