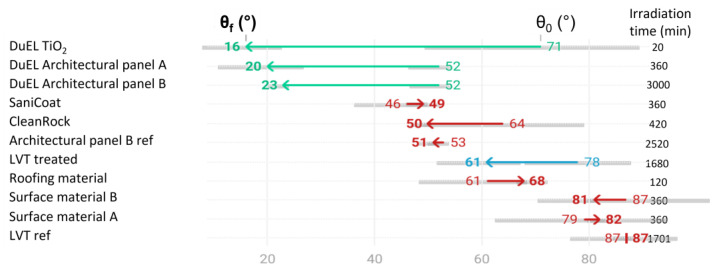
Figure 4.
Overview of the evolution the water contact angle from the oleic-acid-fouled surface before UV irradiation (θ0) to the final contact angle after UV irradiation (θf) and the corresponding required irradiation time (tf) in minutes. The samples can be divided into three groups: the photocatalytically active samples (green arrows), the semi-active samples (blue arrows) and the inactive samples (red arrows). The grey bars represent the experimental error.

