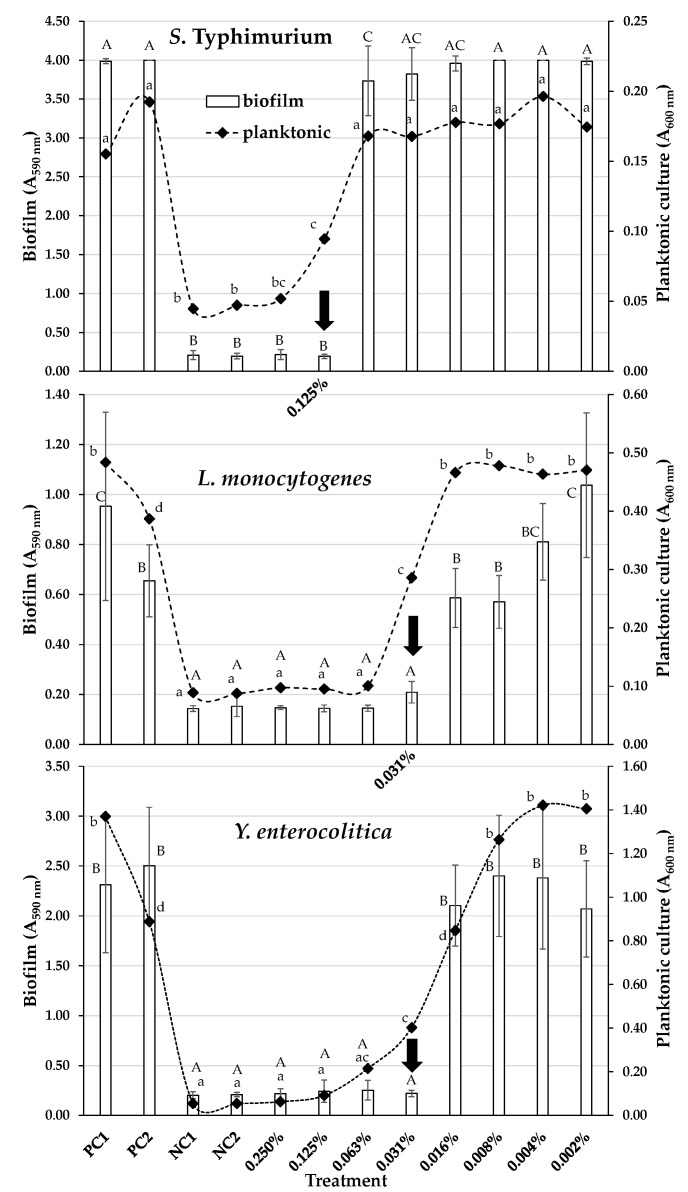
Figure 1.
Biofilm formation (A590 nm) by S. Typhimurium, L. monocytogenes, and Y. enterocolitica strains on the PS surface of the 96-well microtiter plates, in the presence of eight different T. capitatus EO concentrations (two-fold dilutions ranging from 0.25 to 0.002 % v/v). The bars represent the mean values ± standard deviations. The accumulated biofilm biomasses for two positive (PC1, PC2) and two negative controls (NC1, NC2) are also shown. For each bacterial strain, the MBIC of the EO (resulting in the total inhibition of biofilm formation) is indicated by the vertical arrow. The absorbances of planktonic suspensions (A600 nm) found in the same wells at the time of sampling (96 h) are also shown for each treatment (as rhombuses joined by dotted curved lines). The bars of standard deviations of the planktonic means were omitted for clarity. In each graph (bacterial strain), mean biofilm values followed by different superscript uppercase letters (ABC) differ significantly (p < 0.05). In each graph, mean planktonic values followed by different superscript lowercase letters (abcd) differ significantly (P < 0.05).

