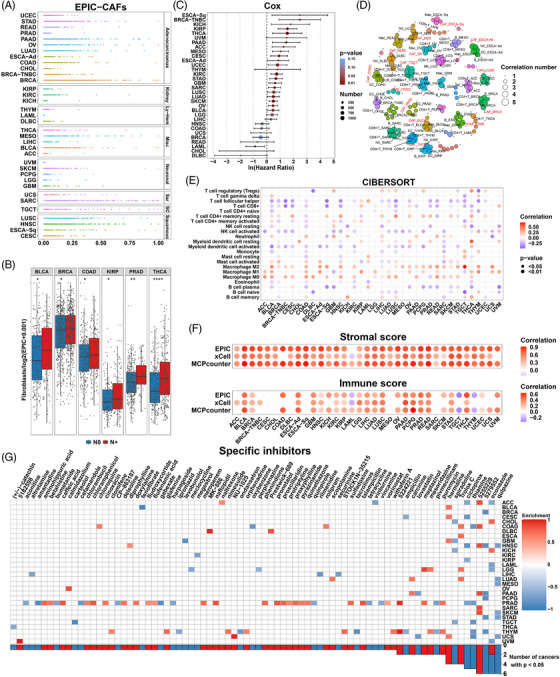
FIGURE 2.

Clinical relevance and significant roles of CAFs in the tumor microenvironment. (A) Relative abundance of EPIC‐estimated fibroblasts in 33 cancers from the TCGA pan‐cancer cohort. (B) Boxplots comparing the abundance of fibroblasts in cancer samples with or without lymph node metastasis. N0 (lymph node negative) and N+ (lymph node positive) are represented as blue and red, respectively. p values from Student's t‐test. (C) Hazard ratio for overall survival of higher fibroblast abundance. p values from Cox regression model. (D) Crucial components in TME of cancers. Correlation number: The number of other cells correlated with specific cells in the TME (criteria: |Correlation R| > 0.3 and p < 0.05). p values from Spearman correlation analysis. (E) Correlation between fibroblast score (EPIC) and CIBERSORT LM22 immune cell score. Only significant values are shown (p < 0.05). Positive and negative correlations are represented as red and blue. p values from Spearman correlation analysis. (F) Correlation between fibroblast score (EPIC) and ESTIMATE immune/stromal scores. Only significant values are shown (p < 0.05). Positive and negative correlations are represented as red and blue. p values from Spearman correlation analysis. (G) Heatmap showing enrichment scores of specific compounds from the cMAP database to target fibroblasts for the TCGA pan‐cancer cohorts. The inhibitors are sorted from left to right in the order of ascending number of significantly enriched cancer types. Positive and negative enrichment scores are represented as red and blue. p values from cMAP analysis. p values are reported as follows: ns, nonsignificant; *, p < 0.05; **, p < 0.01; ***, p < 0.001; ****, p < 0.0001.
