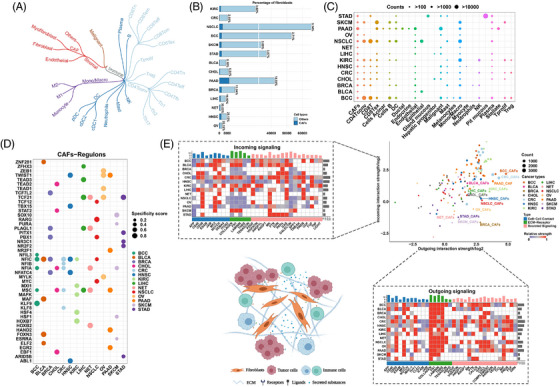
FIGURE 4.

Intercellular crosstalk and transcriptional analysis of CAFs in single‐cell sequencing cohorts. (A) Brief classification of malignant, immune and stromal components in the tumor microenvironment. (B) Barplot showing the counts and percentage of fibroblasts in the enrolled cohorts. CAFs and other cells are represented as dark blue and light blue. (C) Bubble plot showing the counts of individual cells in cohorts. The cell counts are represented by the bubble size. (D) Bubble plot showing the top five transcriptional modules analyzed by SCENIC. Specificity scores are represented by the bubble size. (E) The relative strength of incoming (top left) and outgoing (lower right) signalling for cancer‐associated fibroblasts analyzed by CellChat (strength is scaled within individual cancers, and increasing value is represented from purple to red); Scatter plot showing the signalling for all cells in cohorts (cancers are represented as different c, cell numbers are represented as the dot size). Illustration of different kinds of intercellular communications for fibroblasts (lower left).
