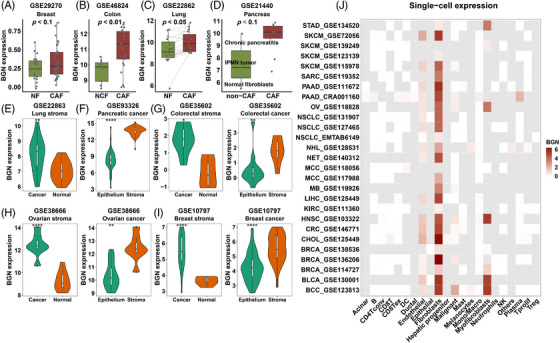
FIGURE 5.

Stromal biglycan is mainly expressed in cancer‐associated fibroblasts. (A) Boxplots comparing BGN expression in CAFs and non‐CAFs of breast (A), colon (B), lung (C) and pancreatic (D) tissues. (E–I) Violin plots comparing the BGN expression of tissue microdissection: the stromal part of normal and cancer tissues of lung, colorectal, ovarian and breast samples; the cancer epithelium and stromal part of pancreatic, colorectal, ovarian, breast cancer. (J) Heatmap showing BGN expression in cells of scRNA‐seq datasets. The log2(TPM/10+1) value is shown, and cells not available are represented as grey tile. p value from paired/non‐paired Student's t‐test (normally distributed) and Wilcoxon rank‐sum test (non‐normally distributed). CAFs and non‐CAFs are represented as red and green. P values are reported as follows: ns, nonsignificant; *, p < 0.05; **, p < 0.01; ***, p < 0.001; ****, p < 0.0001.
