
FIGURE 7.
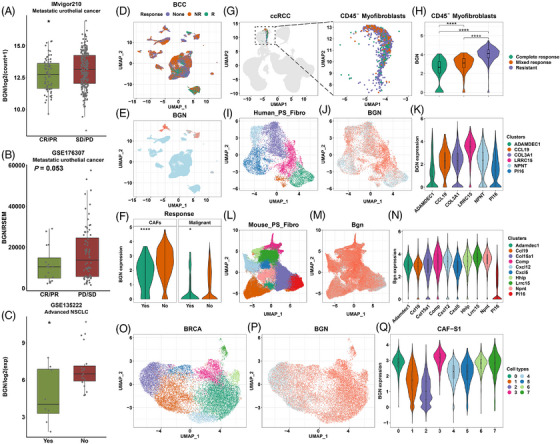
BGN predicts poor response of patients to immunotherapy. Boxplots comparing BGN expression in patients responding or not responding to immunotherapies in metastatic urothelial cancer (A, B) and advanced non‐small cell lung cancer (C). p values from Student's t‐test. BCC scRNA‐seq: Scatter plot showing the distribution of cells from NR (nonresponse), R (response) and None (no record) (D); BGN expression in cells (E); violin plots comparing BGN expression in CAFs and malignant cells of patients with or without response (F). Responses and nonresponses are represented as green and brown, respectively. p value from Student's t‐test. ccRCC scRNA‐seq: Scatter plots showing CD45‐ myofibroblasts (G). Violin plot shows BGN expression in fibroblasts of the complete response, mixed response and resistance groups (H). p value from one‐way ANOVA test and corrected. Complete response, mix response and resistance are represented as green, brown and purple, respectively. Cross‐tissue fibroblast subsets: I–K, Different subsets of human fibroblasts and BGN distribution; L and M, Different subsets of mouse fibroblasts and BGN distribution. Breast cancer CAF‐S1 subsets: Scatter plot showing fibroblast CAF‐S1 subsets (O) and BGN distribution (P); Violin plot showing BGN expression in subsets 0–7 (Q). p values are reported as follows: ns, nonsignificant; *, p < 0.05; **, p < 0.01; ***, p < 0.001; ****, p < 0.0001.