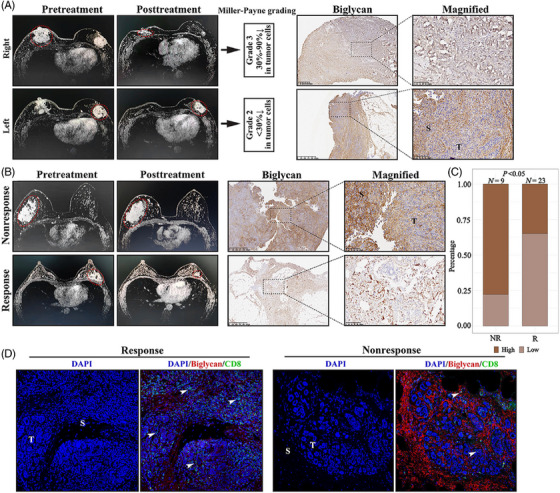
FIGURE 8.

Validation of the correlation between biglycan and immunotherapy response in a clinical cohort. (A) The magnetic resonance imaging (left panel), Miller–Payne grade (middle panel) and immunohistochemical biglycan expression (right panel) in a patient diagnosed with bilateral breast cancer. (B) Representative images of magnetic resonance imaging (left panel) and immunohistochemical biglycan expression (right panel) in response and nonresponse groups. (C) Bar plot showing the proportion of high and low biglycan expression in NR (nonresponse) and R (response) groups. p value from Fisher exact test. (D) Representative image of immunofluorescence showing the biglycan expression and CD8+ T cell infiltration in response and nonresponse groups.
