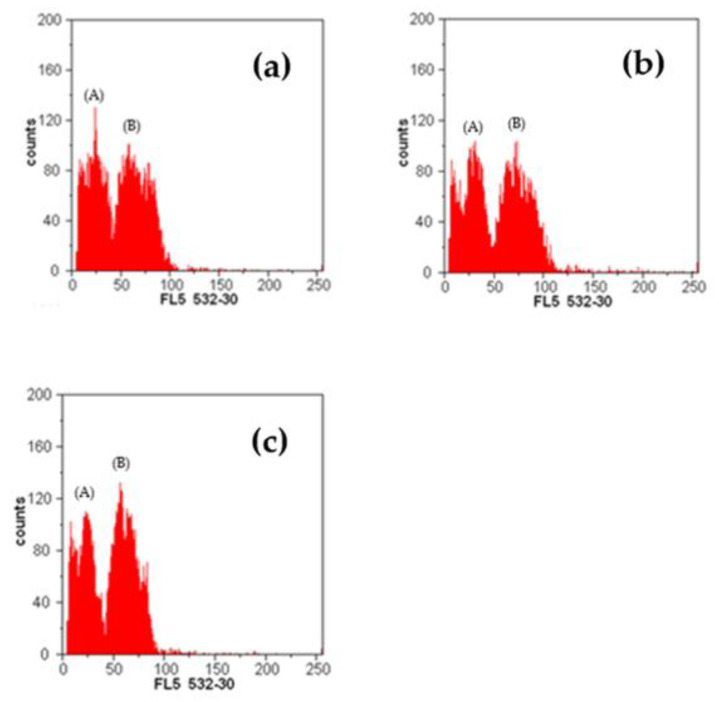
Figure 6.
Flow cytometry histogram showing numbers of nuclei per channel of rosa and the internal calibration standard, Petroselinum crispum, versus channel numbers (which are linearly proportional to the amount of DNA). (a) G1 peaks of Rosa spinosissima (A) and standard (B). (b) G1 peaks of Rosa pendulina (A) and standard (B). (c) G1 peaks of Rosa pendulina × spinosissima (A) and standard (B).

