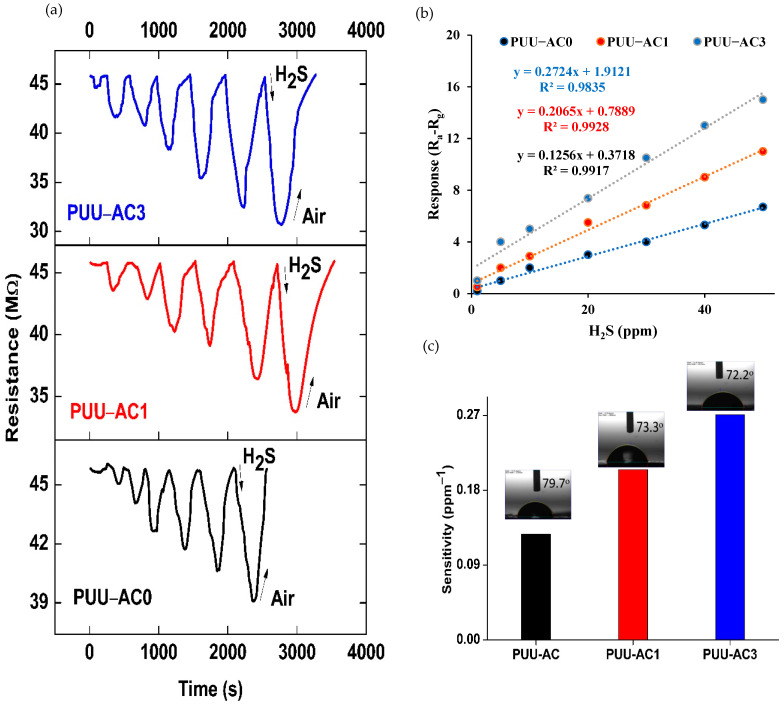
Figure 7.
(a) Current-time transient responses of sensor PUU-AC0, PUU-AC1 and PUU-AC3 to different concentrations of H2S in a range of 50-1 ppm. (b) Response curves of PUU-AC0, PUU-AC1 and PUU-AC3 sensor to increasing concentrations of H2S in 60% RH (V = +1 V). (c) The sensor sensitivity values were reported in the bar plot with water contact-angle pictures of samples captured by microscope (inset).

