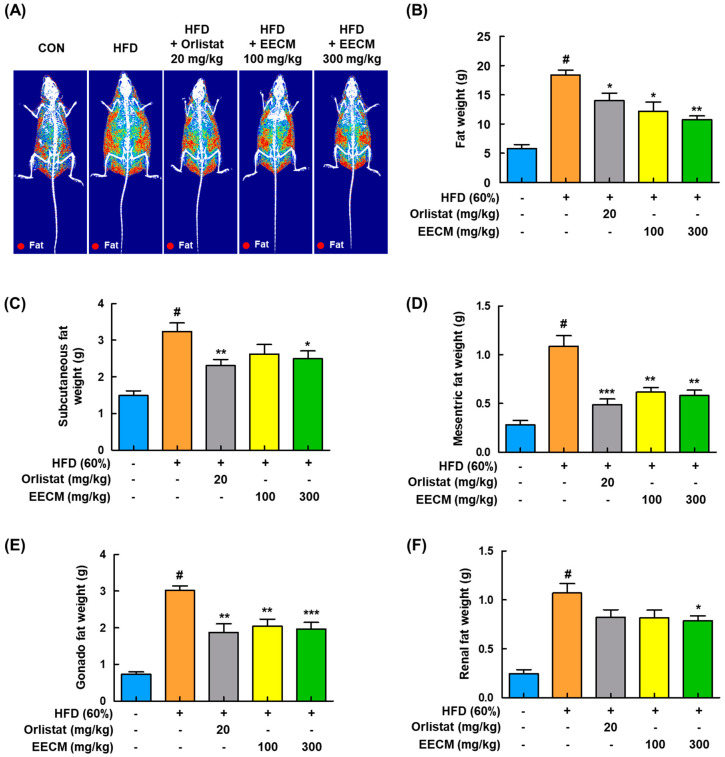
Figure 5.
Regulatory effects of EECM on body composition and fat mass in HFD (60%)-induced obese mice. (A) Radiography images of the fat tissues are presented. (B) Fat weight in each group was measured via DEXA analysis. Fat was obtained from each tissue after the sacrifice of mice, and the weight was measured. (C–F) Subcutaneous fat, mesenteric fat, gonadal fat, and perirenal fat weights. Values are represented as the mean ± SEM (DEXA analysis; n = 3/group, fat in tissue weight: n = 8/group). # p < 0.05 vs. the CON group; * p < 0.05, ** p < 0.01, and *** p < 0.001 vs. the HFD (60%)-induced obese group.

