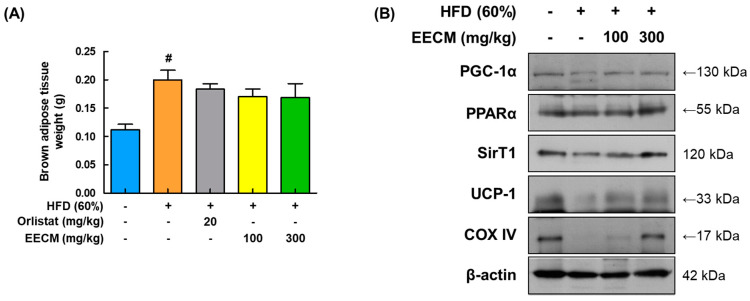
Figure 9.
Stimulating effects of EECM on thermogenesis in the BAT. (A) Weights of BAT in each group. (B) Expression levels of thermogenesis-related proteins PGC-1α, PPARα, SIRT1, UCP-1, and COX-IV were determined via Western blotting analysis. Values are represented as the mean ± SEM (n = 8/group). # p < 0.05 vs. the CON group.

