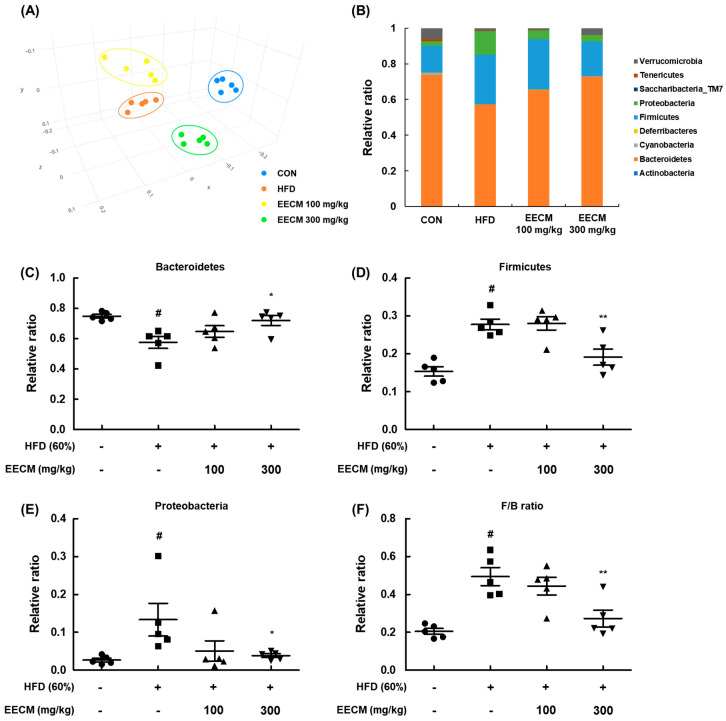
Figure 10.
Regulatory effects of EECM on microbiota composition and colonization. (A) β-diversity between groups was analyzed using the principal coordinate analysis (PCoA) plot. (B) Ratio of phylum level composition ratio of each group. (C–F) Relative ratio of Bacteroidetes, Firmicutes, and Proteobacteria and the Firmicutes/Bacteroidetes (F/B) ratio. Values are represented as the mean ± SEM of five mice per group. # p < 0.05 vs. the CON group; * p < 0.05 and ** p < 0.01 vs. the HFD (60%)-induced obese group.

