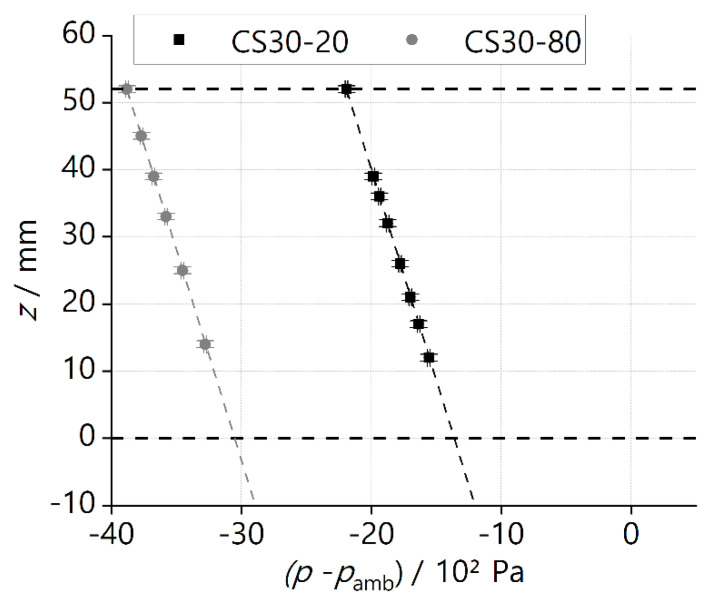
Figure 9.
Experimental data (symbols) and calculated hydrostatic head (dotted lines, Equation (14)) from phase−separation experiment at different flow rates for samples with 30 wt% of solid loading. Details corresponding to each data point are given in Table 7 and Table 8. The vertical error bar for height measurement z is ±0.5 mm and the horizontal error bar for pressure difference () is ±0.1 hPa.

