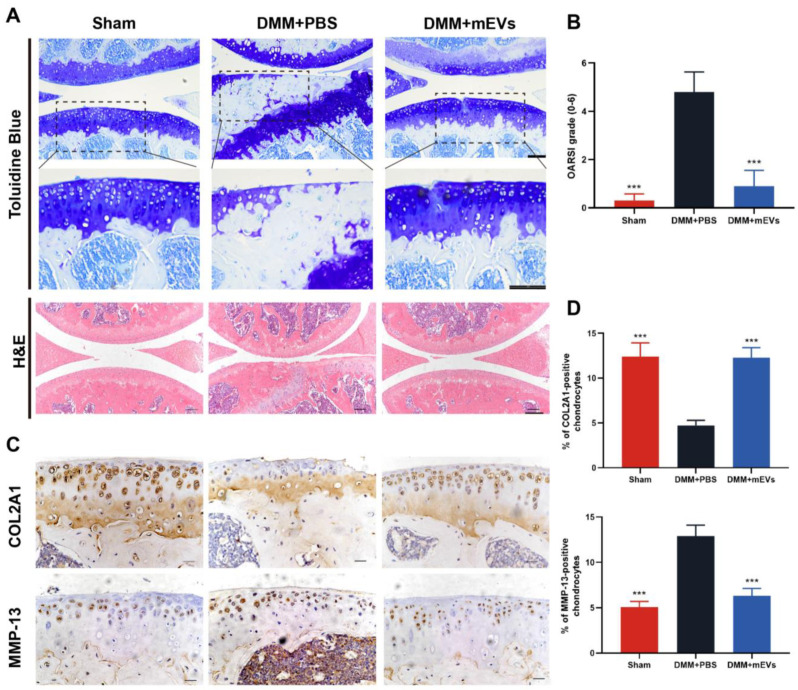
Figure 4.
Effects of mEVs on cartilage degradation in DMM-induced mice. (A) Toluidine blue and hematoxylin–eosin-stained sections of knee joints. Scale bars: 100 μm. The dashed black box indicates the magnified region. (B) The joint lesions were graded on a scale of 0–6 using the OARSI scoring system. Data were presented as the mean ± SD (n = 5). (C,D) Immunohistochemistry analysis of COL2A1 and MMP-13 in sections of tibial plateau of knee joints. Scale bar, 25 μm. All data are shown as means ± SD deviation (n = 5). *** p < 0.001 vs. DMM+PBS group.

