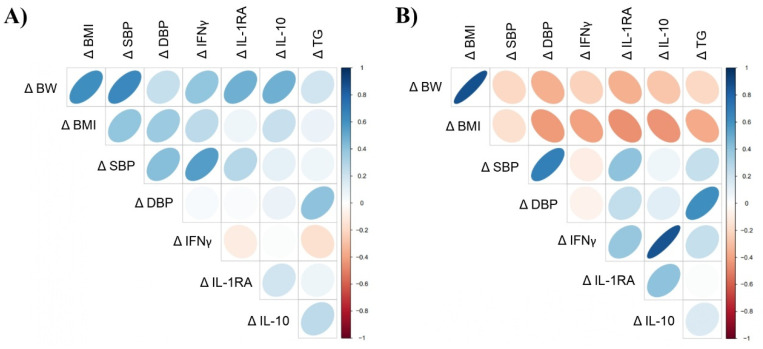
Figure 5.
Spearman’s correlations between variables showing significant change over the intervention period in (A) cherry and (B) placebo. Direction of ellipses represents positive or negative correlations, and the width represents the strength of the correlation (narrow ellipse = stronger correlation). Δ = D30-D1. Spearman r coefficient and p values are shown in Supplementary Table S8.

