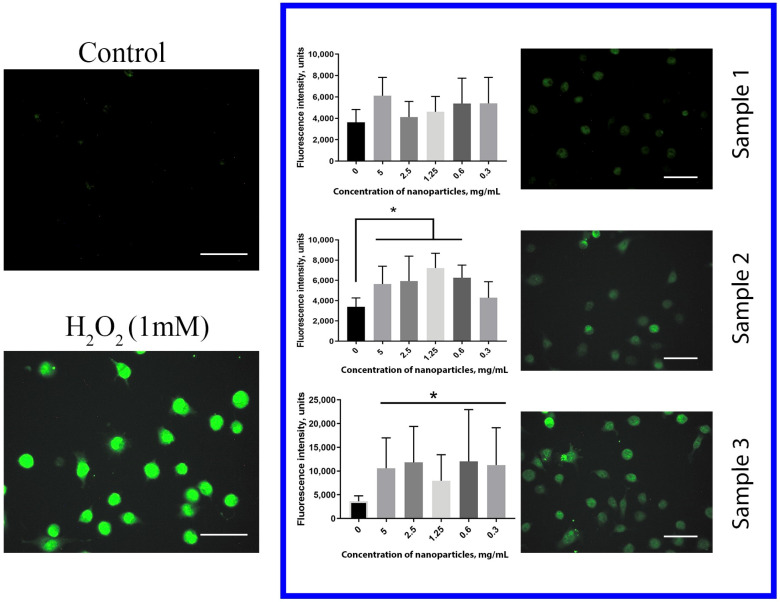
Figure 7.
ROS-level assessment after 24 h of incubation with Ce0.8Gd0.2O2−x nanoparticles; hMSc were labelled with DCF (40 µM) and incubated for 30 min. Cells were analysed using a fluorescent plate reader (Tecan Infinity 200). Mean +/− standard deviation (SD) is plotted for five replicates. * p < 0.05. Scale bar is 100 µm.

