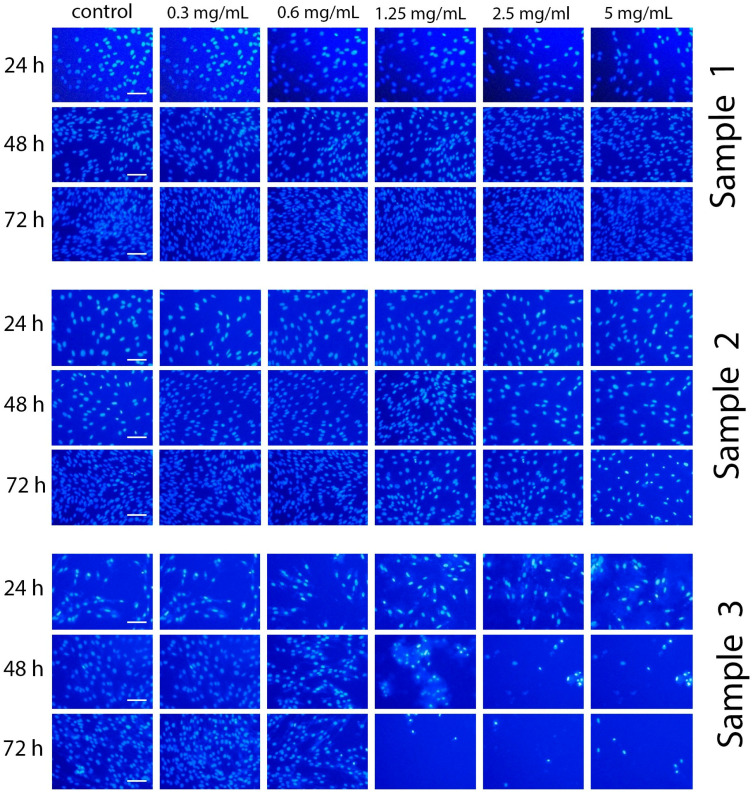
Figure 8.
Micrographs of hMSc after 24, 48 and 72 h of incubation with Ce0.8Gd0.2O2−x nanoparticles (0.3–5 mg/mL) and a quantitative estimation of the proportion of cells with nuclear apparatus abnormalities (fragmentation or change in the morphology of the nucleus) after 72 h of cultivation (staining with Hoechst 33342). All the images were taken at the same magnification. Scale bar is 100 µm.

