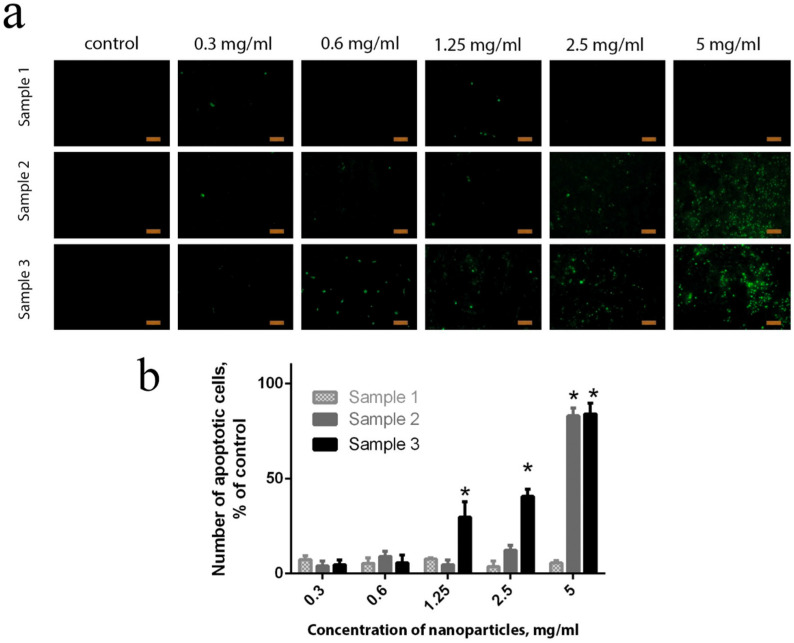
Figure 9.
Identification of apoptotic cells after 24 h of incubation with different concentrations of Ce0.8Gd0.2O2−x NPs. hMSc cells were stained with YO-PRO-1 dye (1 µM) and were further observed under a fluorescence microscope (a). A quantitative assessment of apoptotic cells was performed by analysing at least three areas from three different images (b). In the control sample, no Ce0.8Gd0.2O2−x nanoparticles were added. Mean +/− standard deviation (SD) is plotted for five replicates. * p < 0.05. Scale bar is 100 µm.

