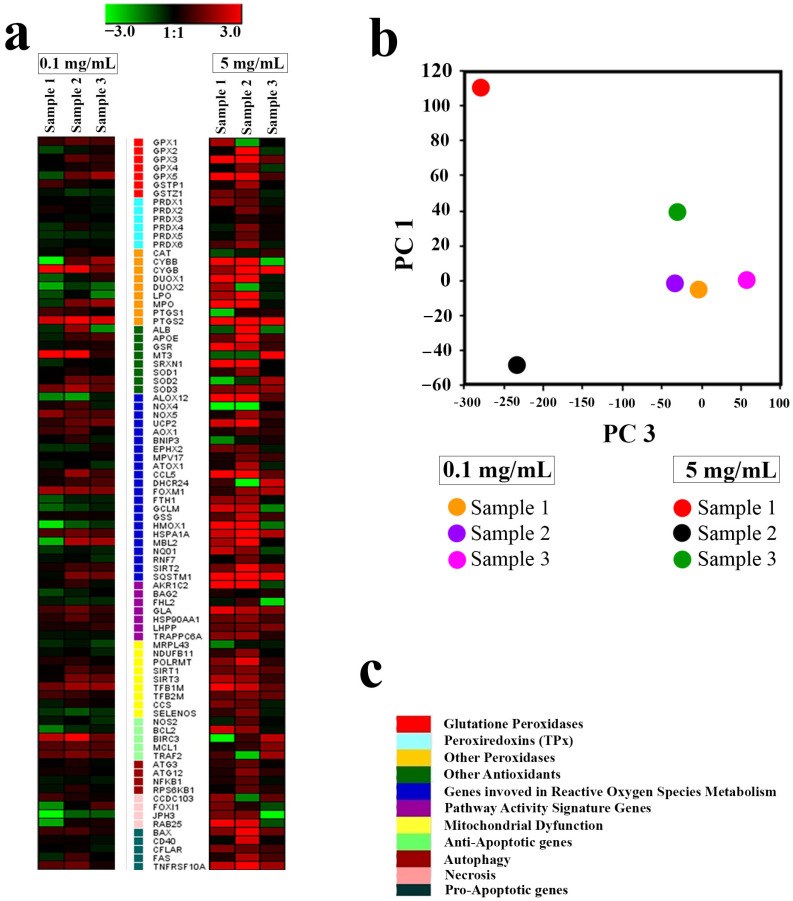
Figure 10.
Heat maps of gene expression in hMScs treated with Ce0.8Gd0.2O2−x NPs (0.1 and 5 mg/mL) after 24 h of incubation (a). The intensity scale of the standardised expression values ranges from 3 (green: low expression) to +3 (red: high expression), with a 1:1 intensity value (black) representing the control (non-treated). A principal component analysis (PCA) of RT-PCR data for the cells treated with samples of Ce0.8Gd0.2O2−x NPs (b). Cluster groups of genes and their functionality (c).

