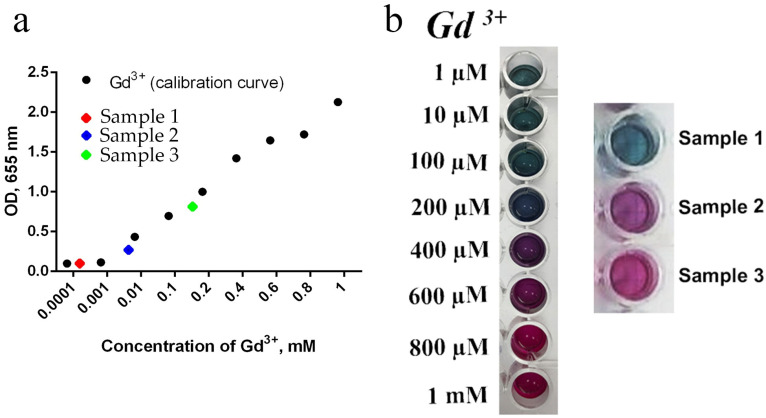
Figure 11.
Analysis of free gadolinium content in saline after incubation with Ce0.8Gd0.2O2−x nanoparticles. (a) Optical density (OD) values at 655 nm of the controls (black dots) and of the colloid solution of Ce0.9Gd0.1O1.95 NPs mixed with arsenazo III (red, blue and green dots). (b) The appearance of gadolinium(III) nitrate aqueous solutions of various concentrations (0.001–1.000 mM) mixed with arsenazo III, used as controls for the construction of the calibration curve.

