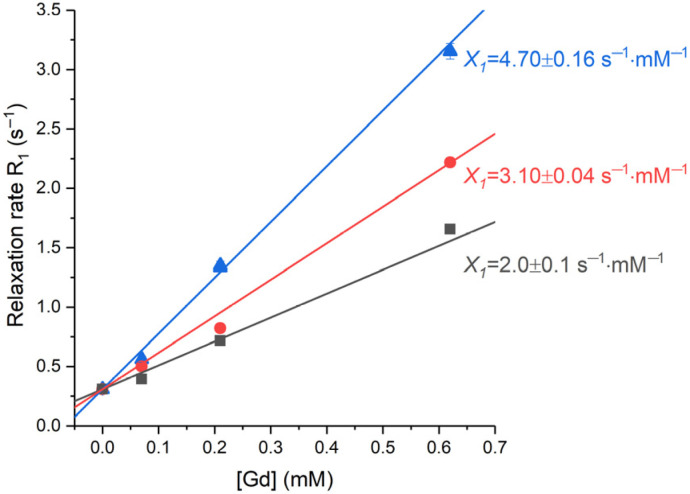
Figure 12.
The dependencies of relaxation rate on the concentration of gadolinium for Samples 1–3 at 16.4 T, 27 °C. Black squares—Sample 1, red circles—Sample 2, blue triangles—Sample 3. Lines show the best linear fit of the data; longitudinal-relaxivity values are provided near the corresponding lines.

