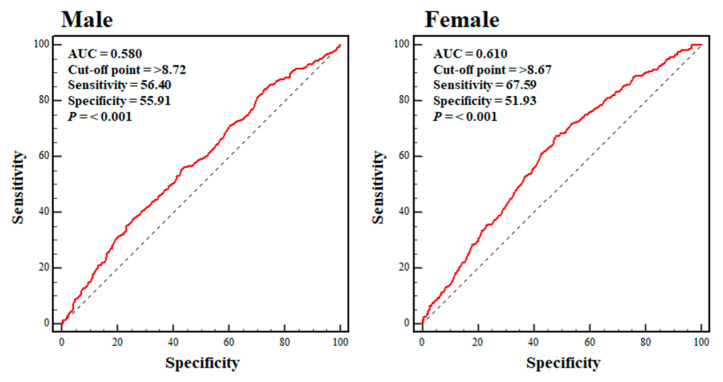
Figure 3.
Sex-specific ROC curves pertaining to the TyG index for the sarcopenic obesity group. Dotted blue line: reference; solid red line: AUC, indicative of the accuracy of the use of the TyG index for the identification of sarcopenic obesity; cut-off value: the value of the TyG index that predicts sarcopenic obesity; sensitivity: the probability of individuals who actually have sarcopenic obesity being identified as having sarcopenic obesity; specificity: the probability of individuals who do not have sarcopenic obesity being identified as not having sarcopenic obesity. Abbreviations: AUC, the area under the curve; ROC, receiver operating characteristic.

