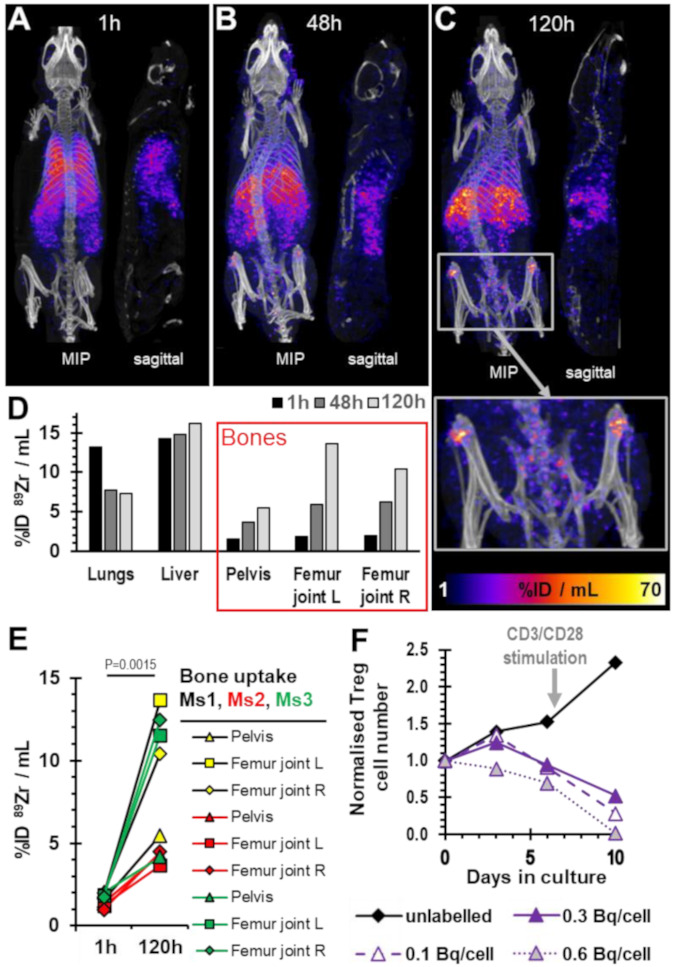
Figure 5.

In vivo imaging of 89Zr-Tregs. (A–C) PET/CT overlay images of a representative BRG mouse that had received HLA-A2-negative 89Zr-Tregs (0.1 Bq/cell; 5 × 10⁶; 0.7 MBq total radioactivity administered) with HLA-A2-positive Teffs admixed (5 × 10⁶). Time points refer to the time passed after adoptive cell transfer. Maximum intensity projection images and sagittal sections of one of n = 3 mice are shown. The images are from the same mouse across (A–C). The inset in (C) shows 2-fold zoom of the pelvic area, clearly visualizing widespread and strong PET signals in various bones. (D) Quantitative ROI analysis of relevant tissues from the representative mouse shown in (A–C). (E) Comparison of three bone areas across three different mice imaged 1 h or 120 h after adoptive cell transfer. P-value calculated using two-tailed t-test (paired for each bone type in each mouse). n = 3 mice were used in this experiment and three different bone types analyzed per mouse. (F) The same 89Zr-Treg batch that was administered to mice was also analyzed in vitro for its expansion capability (solid line). Controls were unlabelled (black) and higher labelled (dashed, dotted lines) Tregs from the same donor. Immediately after day 6, all cultures were re-stimulated with CD3/CD28 beads (arrow).
