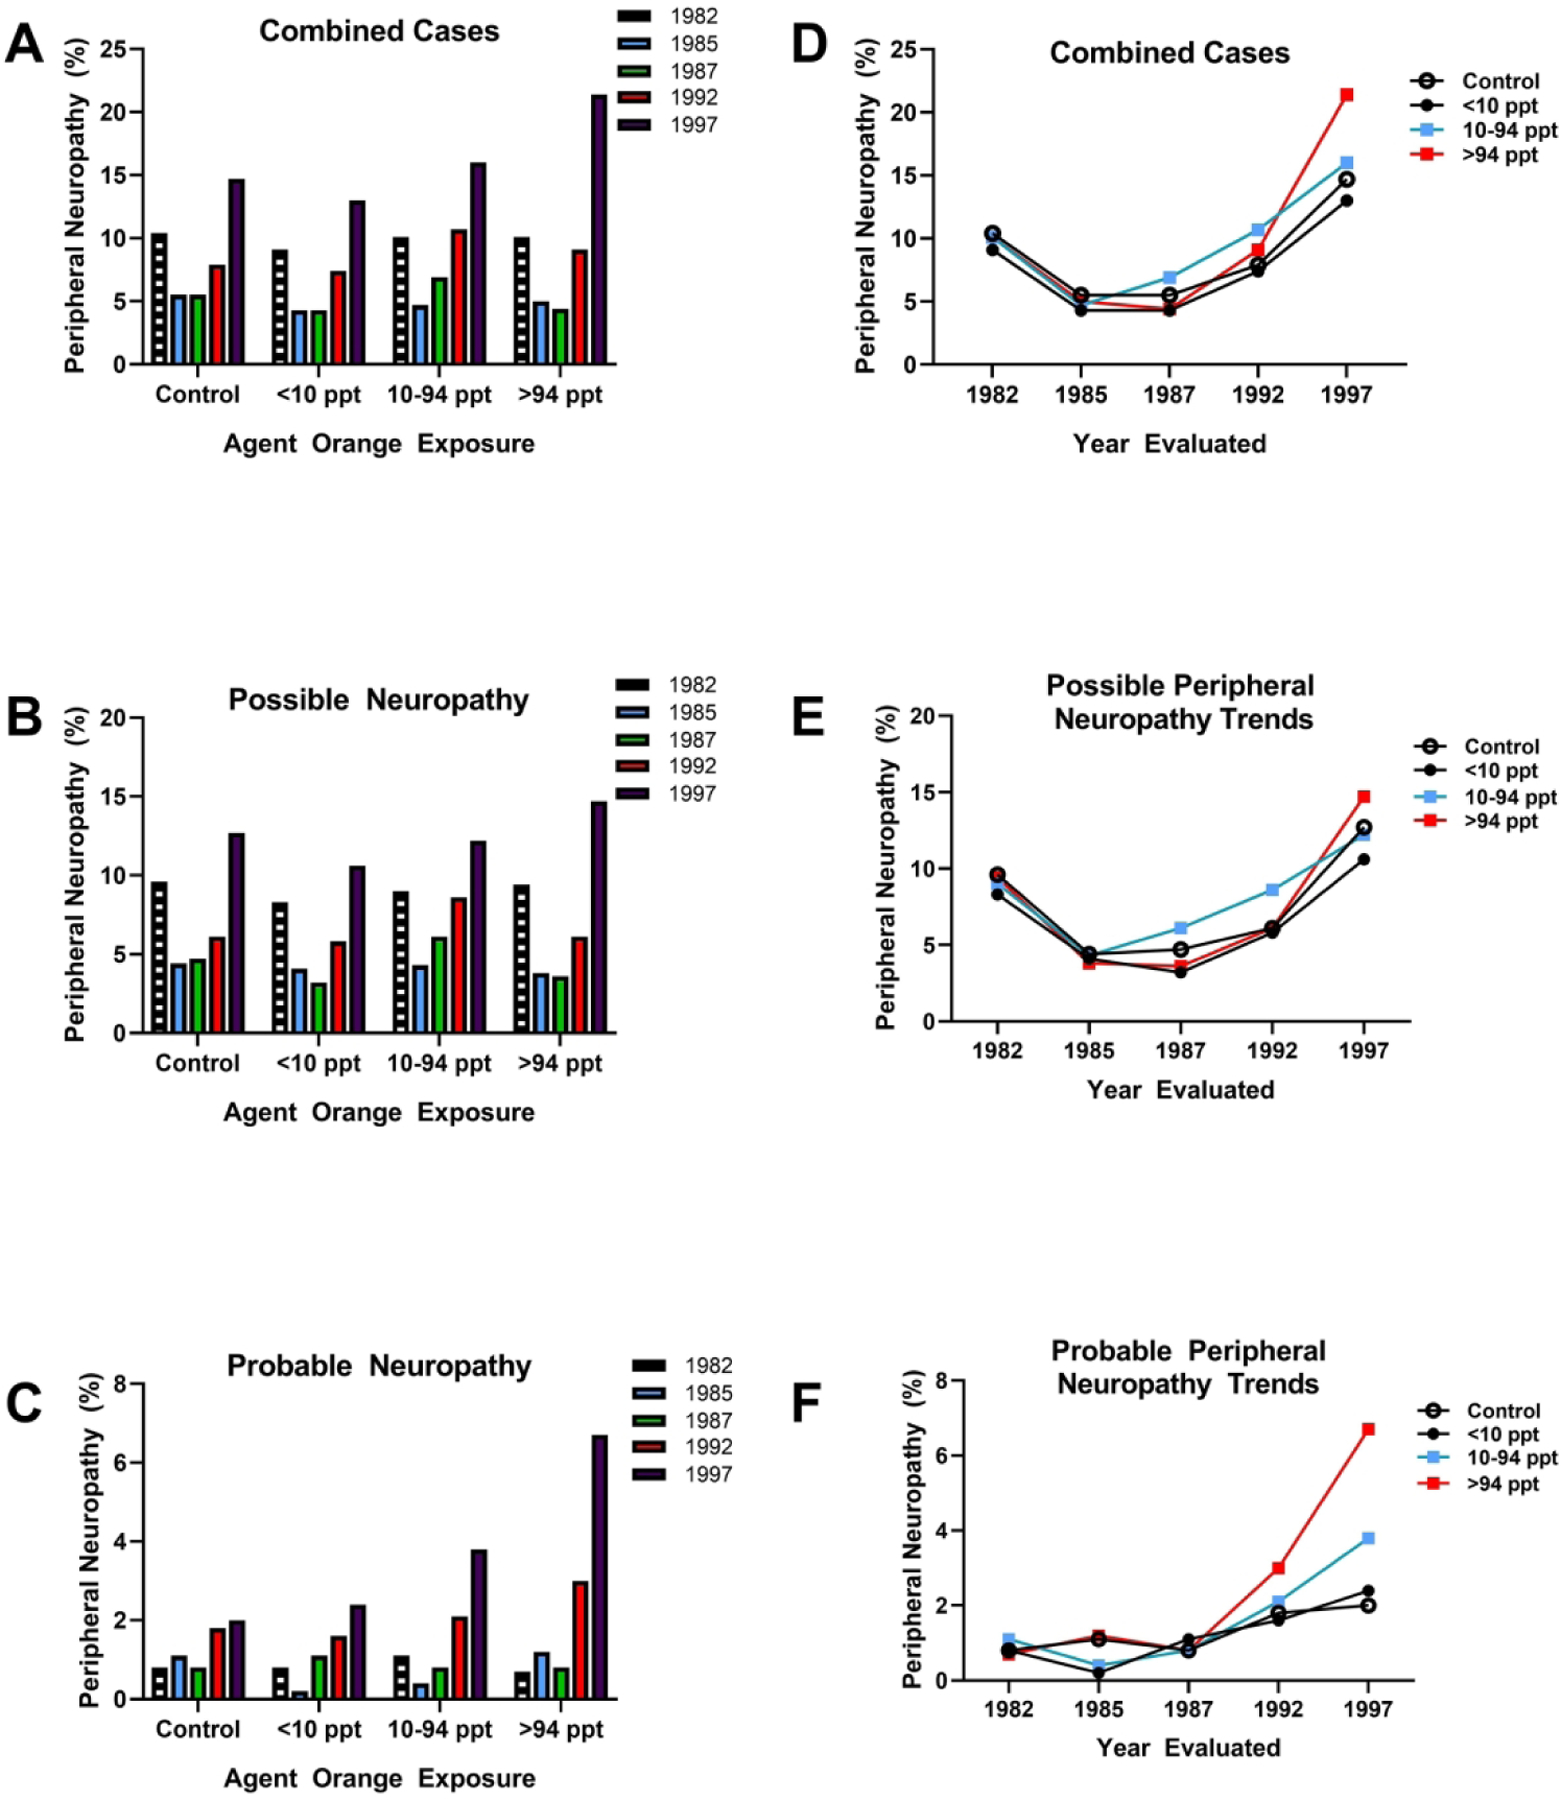
Figure 2:

Comparative analysis of Agent Orange/TCDD exposure levels in relation to peripheral neuropathy rates over time. Data were extracted from a study of veterans of Operation Ranch Hand in which peripheral nerve function was assessed over time from 1982 to 1997. Neuropathies were categorized as possible or probable (13). A) Rates of combined (possible+probable) peripheral neuropathy, B) possible neuropathy and C) probable neuropathy diagnosed in 1982, 1985, 1987, 1992 and 1997 in controls and veterans exposed to less than 10 parts per trillion (ppt), between 10–94 ppt or greater than 94 ppt of Agent Orange and TCDD. The largest effect size was detected in veterans diagnosed with (C) probable neuropathy in which dose dependent increases in prevalence were detected at the 10–94 ppt and >94 ppt exposures. Panels D-F display the same data by showing comparative shifts in (D) combined, (E) possible and (F) probably neuropathy over time with comparisons across exposure doses. (F) Clearly with aging, higher exposures doses were associated with higher rates of probable neuropathy.
