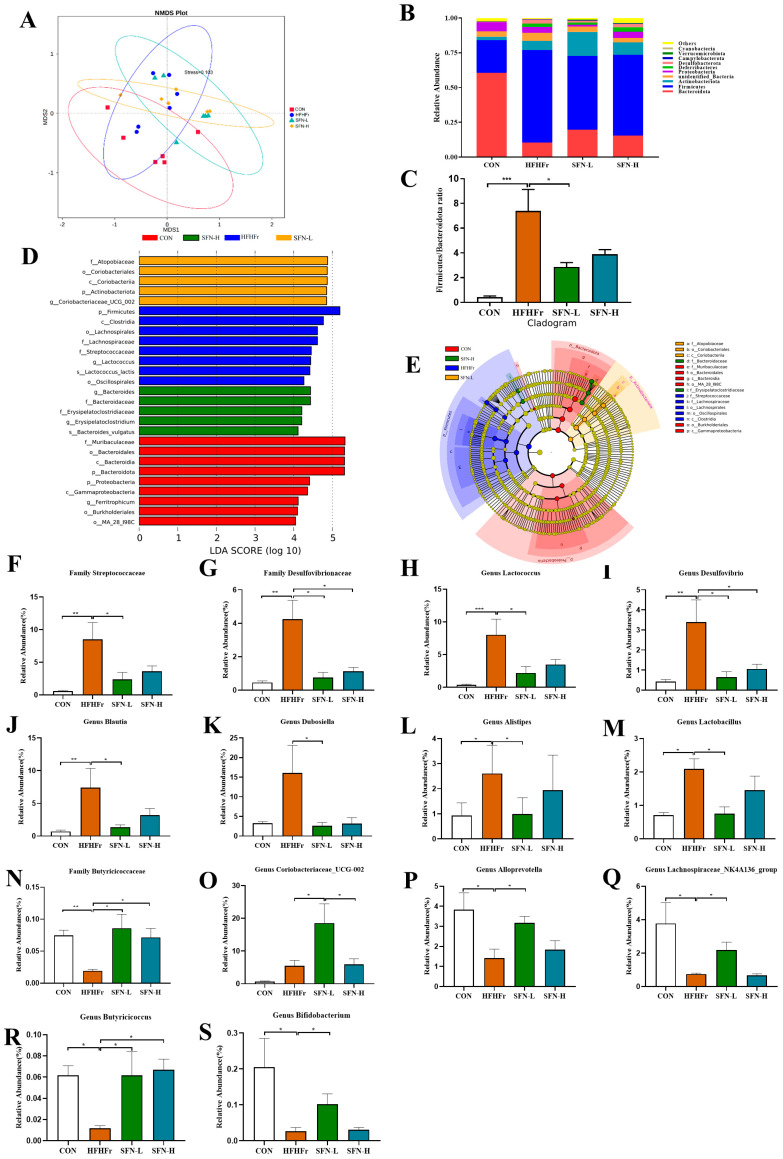
Figure 2.
The intervention of SFN improves gut dysbiosis induced by the HFHFr diet. (A) Nonmetric multidimensional scaling (NMDS) plot based on the Bray–Curtis distance. (B) The relative abundance of the top ten abundant bacteria at the phylum level. (C) The ratio of Firmicutes/Bacteroidota. (D) Linear discriminate analysis effect size (LEfSe) analysis of the dominant biomarker taxa among the four groups. The threshold of the logarithmic score of LDA analysis was 4.0. (E) Taxonomic cladogram obtained from LEfSe analysis by comparing 4 groups. (F–S) Relative abundances of 14 significantly altered bacterial genera or families: (F) Streptococcaceae, (G) Desulfovibrionaceae, (H) Lactococcus, (I) Desulfovibrio, (J) Blautia, (K) Dubosiella, (L) Alistipes, (M) Lactobacillus, (N) Butyricicoccaceae, (O) Coriobacteriaceae UCG_002, (P) Alloprevotella, (Q) Lachnospiraceae_NK4A136_group, (R) Butyricicoccus, and (S) Bifidobacterium. Data are presented as mean ± SEM (n = 6). * p < 0.05, ** p < 0.01, *** p < 0.001 compared with HFHFr.

