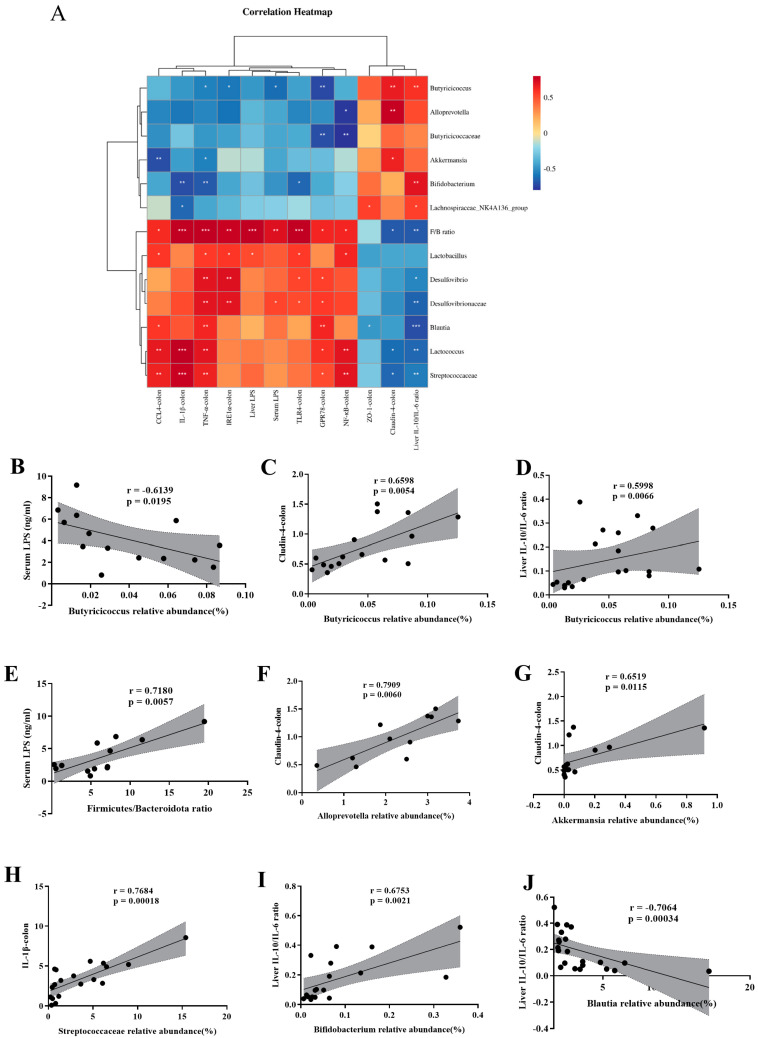
Figure 6.
Spearman correlation analysis supports that SFN ameliorates HFHFr mice via the microbe–gut–liver axis. (A) Heatmap of the association between microbiota and some other experimental results. The intensity of the color is proportional to the intensity of the Spearman correlation. (B) Serum LPS levels were negatively correlated with the relative abundance of Butyricicoccus. (C) Relative mRNA expression of Claudin-4 in the colon was positively correlated with the relative abundance of Butyricicoccus. (D) IL-10/IL-6 ratio in the liver measured by ELISA was positively correlated with the relative abundance of Butyricicoccus. (E) Serum LPS levels were positively correlated with the Firmicutes/Bacteroidota ratio. (F) Relative mRNA expression of Claudin-4 in the colon was positively correlated with the relative abundance of Alloprevotell. (G) Relative mRNA expression of Claudin-4 in the colon was positively correlated with the relative abundance of Akkermansia. (H) Relative mRNA expression of IL-1β in the colon was positively correlated with the relative abundance of Streptococcaceae. (I) IL-10/IL-6 ratio in the liver measured by ELISA was positively correlated with the relative abundance of Bifidobacterium. (J) IL-10/IL-6 ratio in the liver measured by ELISA was negatively correlated with the relative abundance of Blautia. * p < 0.05, ** p < 0.01, *** p < 0.001 compared with HFHFr.

