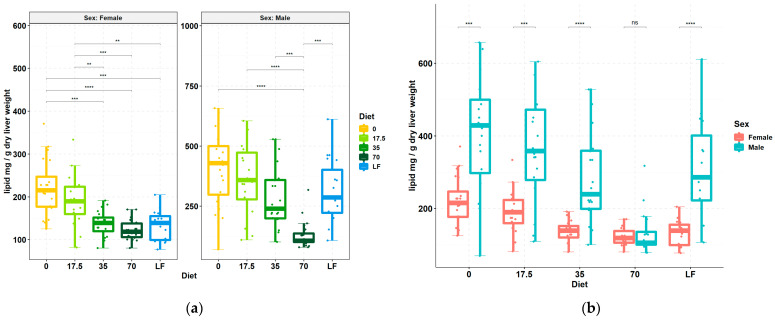
Figure 1.
Effect of dietary bean on the liver lipid content. Box plots report amount of hepatic lipid (in mg) normalized to g of dry liver weight across the diet groups and sex cohorts. Diets are indicated by the percent (%) of dietary protein provided by bean, including a low-fat (LF) diet as a negative control. Kruskal–Wallis testing showed significant differences by the diet effect (χ2 = 41.598, p-value = 2.021× 10⁻⁸ in the female cohort; χ2 = 40.15, p-value = 4.029 × 10⁻⁸ in the male cohort). (a) Pairwise comparisons between the diet group were conducted using the post-hoc Dunn test; (b) Pairwise comparison between sex cohorts were tested with the Mann–Whitney U test. The Benjamini–Hochberg method was used for the multiple testing correction of p-values. ** p-value < 0.01; *** p-value < 0.001; **** p-value < 0.0001.

