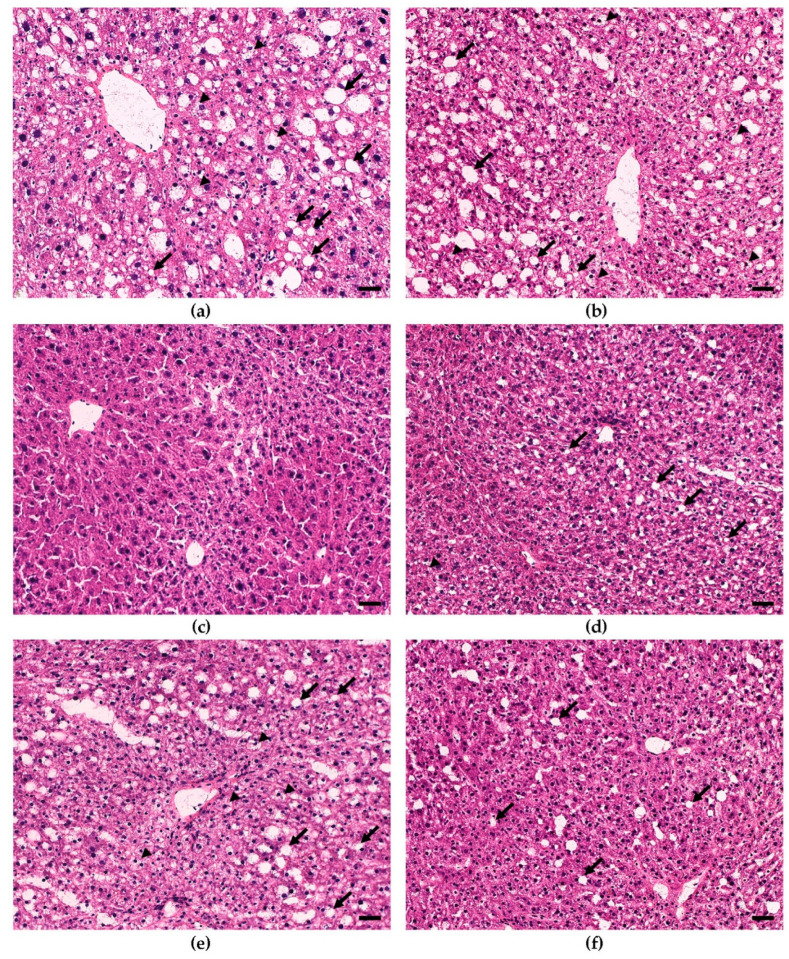
Figure 2.
Comparison of lipid accumulation in male and female H&E-stained liver sections across different diets. (a) Male 0%; (b) Female 0% bean; (c) Male 70% bean; (d) Female 70% bean; (e) Male low fat; (f) Female low fat. Steatosis (arrows); hepatocyte ballooning (arrowheads); magnification 200×; bars = 40 µm.

