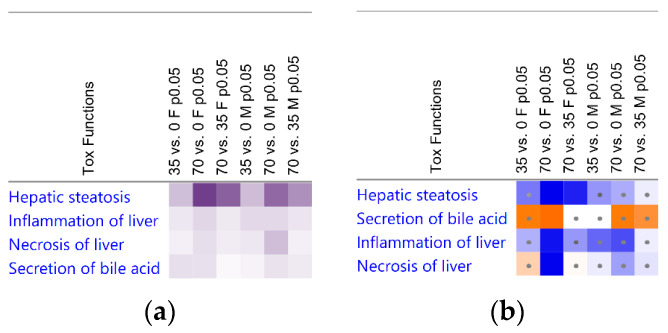
Figure 4.
Heatmap of the Hepatotoxicity Functions based on the differentially expressed gene patterns in the liver tissue samples of female (F) and male (M) mice. Functions were organized by the collective score values. Pairwise comparisons are indicated in the column headers with first three from the left for the females and the other three columns for the males. Significant functions were filtered by B-H p-values < 0.1 and |z|-scores > 2, (a) shades of purple indicate −logB-H p-values; (b) blue shades indicates inhibition, orange—activation, for 70% diet group in at least one sex cohort. Dots denote insignificant |z|-scores < 2.

