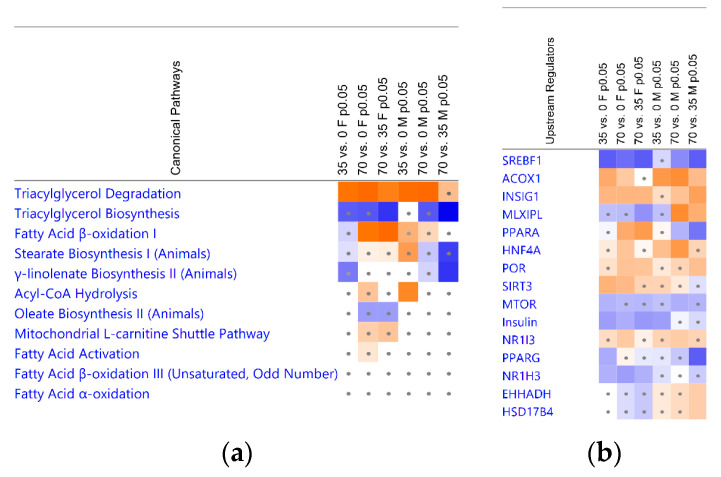
Figure 5.
Canonical pathways and upstream regulators associated with fatty acid metabolism in liver upon consumption of common bean. (a) Canonical pathways; (b) upstream regulators. Pairwise diet comparison groups are indicated in the columns. Heatmap colors and their intensity indicate activity status according to the z-score values direction: orange signifies activation and blue—inhibition. Dots denote insignificant |z|-scores < 2. Indicated pathways had a significant p-values of overlap < 0.05 (B-H p-values < 0.1) and are organized by the collectively largest absolute z-score values across the comparisons.

